This is the article that ties everything together. Every other guide in the Academy teaches you a concept — odds, vig, xG, biases, market mechanics. This one shows you how to combine them into a repeatable workflow that you follow before every single bet.
Professional punters don’t win because they know more than you. They win because they do the same things in the same order every time, and they never skip a step. The process protects them from emotion, bias, and impulse. That’s the edge — not a secret formula, but disciplined execution.
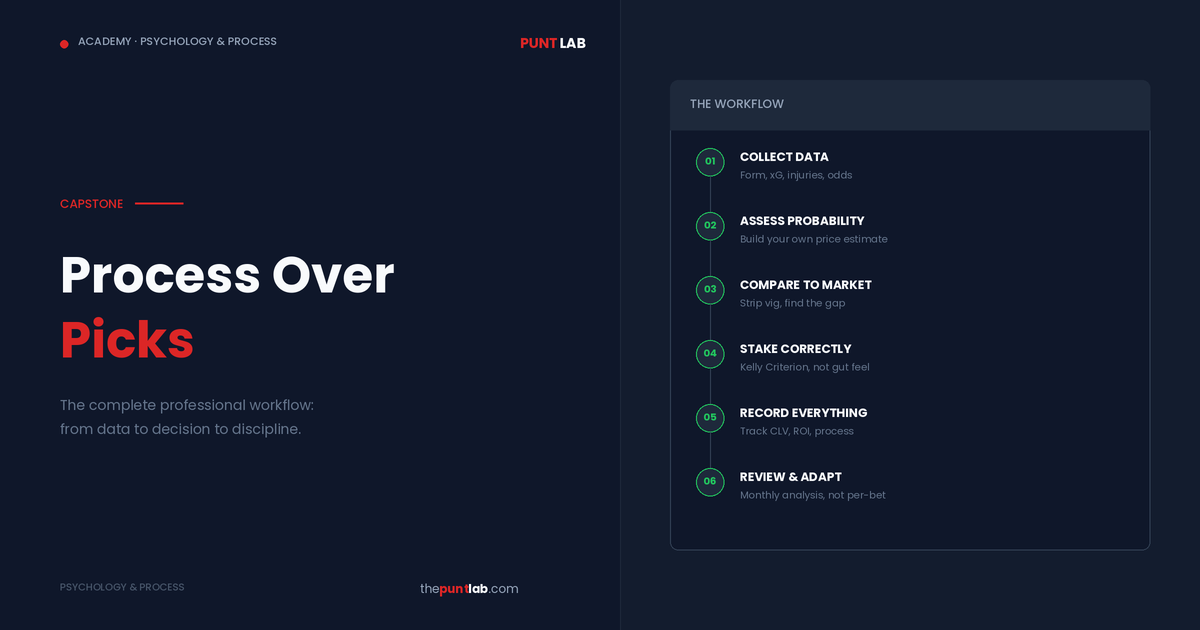
Here’s the complete workflow.
Step 1: Collect the Data
Before you even think about placing a bet, you need the raw information. Every serious assessment starts with data collection, not opinion.
For football: Check the team’s form, xG data (both for and against), injuries and suspensions, home/away splits, and head-to-head record. The Data Hub pages for the Premier League, La Liga, Bundesliga, Serie A, and Ligue 1 give you most of this in one place.
For racing: Review the form guide, check sectional times for hidden merit, build or review the speed map to understand the likely race shape, and note track conditions, barrier draws, and jockey/trainer form.
For any sport: Check team news, fixture context (is this a dead rubber or a must-win?), and any schedule factors like fixture congestion that might affect performance.
The key discipline at this stage is completeness. Don’t cherry-pick the data that supports your initial hunch — that’s confirmation bias, and it’s the most common mistake in betting. Collect everything first, then assess.
Step 2: Form Your Own Probability Estimate
This is the step that separates professionals from recreational punters. Before looking at the odds, estimate the probability of each outcome yourself.
You don’t need a sophisticated model. A structured assessment based on the data you’ve collected is enough. Ask yourself: given everything I know about these two teams — form, xG, injuries, home/away, head-to-head, fixture context — what is the percentage chance of each outcome?
For a football match, you might estimate: Home Win 45%, Draw 28%, Away Win 27%. For a horse race, you might estimate your selection has a 20% chance of winning.
The number doesn’t need to be precise to two decimal places. It needs to be honest and based on the data rather than on wishful thinking or gut feel. Write it down before you look at the odds.
Why before? Because once you see the price, your brain anchors to it. If a team is priced at $2.50, your brain automatically processes “40% chance” and adjusts your estimate toward that number. Forming your estimate independently prevents this anchoring bias.
Step 3: Compare to the Market
Now look at the odds. Convert them to implied probability and compare to your estimate.
But don’t compare to the raw implied probability — strip the vig first using the Vig Remover calculator. The raw odds overstate the probability of every outcome because the bookmaker’s margin is built in. You need to see the true market probability to make a fair comparison.
Example: The home team is priced at $2.20 (implied 45.5%). After stripping the vig from a 105% market, the true market probability is approximately 43.3%. Your estimate was 48%. That’s a 4.7 percentage point gap — a meaningful edge.
If your estimate is within 1-2 percentage points of the market’s true probability, there’s no edge. Pass and wait. If your estimate is 3+ points higher, you have a potential bet. If it’s lower, the other side of the market might offer value.
The critical mindset here is that most matches don’t have value on any outcome. Professional punters pass on far more bets than they take. The willingness to pass — to sit on your hands when there’s no edge — is what protects your bankroll.
Step 4: Stake Correctly
You’ve found an edge. Now the question is: how much to bet?
Most recreational punters bet flat stakes or, worse, increase their stakes after losses. Both approaches are suboptimal. The mathematically correct approach is to scale your stake to the size of your edge — bet more when the edge is larger, less when it’s smaller.
The Kelly Criterion calculator gives you the optimal stake based on your estimated probability and the odds available. Full Kelly is aggressive — most professionals use half-Kelly or quarter-Kelly to reduce variance while still capitalising on edge.
The principles are simple: never bet more than your edge justifies, never increase stakes to chase losses, and always express your stakes as a percentage of your current bankroll rather than a fixed dollar amount.
Step 5: Record Everything
Every bet goes in the tracker. No exceptions. This isn’t optional administrative work — it’s the foundation of everything that follows.
Record: the date, the event, the market, your estimated probability, the odds you took, the stake, the result, and your P&L. If possible, also record the closing odds (the final price before the event starts) so you can calculate your Closing Line Value.
Why CLV matters: if you consistently bet at better odds than the closing line, you’re making good decisions regardless of short-term results. CLV is the most reliable predictor of long-term profitability — more reliable than win rate, ROI over small samples, or any other metric.
Our free betting tracker is designed for exactly this. It calculates your running P&L, ROI, win rate by sport and market, and gives you the data you need for the review step.
Step 6: Review and Adapt
At the end of each month, review your results. Not to celebrate wins or mourn losses — to evaluate the process.
Questions to ask:
Are you beating the closing line? If your average odds taken are consistently better than the closing odds, your selection process is working even if the short-term results are negative. If you’re consistently taking worse odds than close, your timing or selection process needs work.
Which markets are profitable? Your tracker will show ROI by sport and market type. You might discover that your football match result bets are profitable but your racing bets are losing. That’s actionable information — either improve your racing process or allocate more bankroll to football.
Are you following the process? Review your bet log and honestly assess how many bets followed the full workflow versus how many were impulse bets, chase bets, or gut-feel bets. The percentage that followed the process should be increasing over time. If it’s not, the issue isn’t your analysis — it’s your discipline.
What has the market taught you? Losing bets aren’t failures if you learn from them. Did you miss a piece of information? Did you overweight one factor and underweight another? Did a specific bias creep in? Each month’s review should produce 2-3 specific, actionable adjustments to the workflow.
The Full Checklist
Before every bet, run through this:
1. Have I collected all relevant data — form, statistics, injuries, context?
2. Have I formed my probability estimate before seeing the odds?
3. Have I stripped the vig and compared my estimate to the true market probability?
4. Is the gap between my estimate and the market’s estimate large enough to constitute an edge (3+ percentage points)?
5. Have I calculated the correct stake using Kelly or a fraction of Kelly?
6. Have I checked whether I’m being influenced by any cognitive bias — confirmation, recency, anchoring, sunk cost?
7. Would I make this bet if I had no previous bets today — if this were the first decision of a clean slate?
If any answer is no, don’t bet. Wait for the next opportunity.
Why Process Beats Picks
The internet is full of people selling picks. “Best bets today.” “Lock of the week.” “95% win rate.” The entire model is built on the idea that the value is in the selection — that if someone just tells you what to bet, you’ll win.
It doesn’t work. And the reason is simple: picks without process are random. You don’t know the edge, you don’t know the stake, you don’t know whether the pick has genuine value or is just someone’s opinion dressed up as analysis. You can’t evaluate it, you can’t learn from it, and you can’t replicate it.
Process is the opposite. It’s systematic, transparent, and improvable. When you follow a process, every result teaches you something. Wins confirm that the process is working. Losses reveal where it can be improved. Over time, the process gets better — and so do the results.
That’s why this article is the capstone of the Academy. Every other guide — odds, vig, expected value, xG, biases — is a tool. This workflow is how you use them together.
The Bottom Line
The punters who win long-term don’t have a secret. They have a process. They collect data before forming opinions. They estimate probabilities before seeing odds. They compare to the market after stripping the margin. They stake according to their edge. They record everything. And they review monthly to get better.
None of these steps are complicated. None require a maths degree or a proprietary model. They require discipline — the discipline to do the same things in the same order every time, even when it’s boring, even when you want to skip a step, even when you’re tempted to chase a loss.
That’s the professional punter’s workflow. It’s not glamorous. It works.
The Complete Academy
- Understanding Betting Odds — Read odds in any format and convert to probability
- Market Percentages (The Vig) — How bookmakers build margin into every price
- Expected Value (EV) — The mathematical foundation of profitable betting
- Expected Goals (xG) Strategy — Data-driven football analysis
- Asian Handicap Explained — Split-stake mechanics for precise betting
- What Is BTTS? — Both Teams to Score with real data
- Over/Under 2.5 Goals — Goals market analysis
- Cognitive Biases — The mental traps that cost punters money
- Tote vs Fixed Odds — Choosing the right system for each bet
- Speed Maps Explained — Predicting race shape
- Sectional Times — Finding hidden merit in the data
- How to Read a Form Guide — Racing fundamentals
Tools
- Odds Converter — Convert between all odds formats
- Vig Remover — Strip the margin to see true probabilities
- Kelly Criterion Calculator — Optimal staking based on your edge
- Free Betting Tracker — Record everything and measure performance