Nobody talks about what betting actually looks like over a decade. Tipsters show you last week’s winners. Forums celebrate the hot streak. Social media is a highlight reel of winning bets and growing bankrolls.
But what does a realistic betting journey look like over 5,000 bets — the roughly 500 bets per year that a serious recreational punter places over a decade? What happens to your bankroll during the 18-month periods where variance turns against you despite doing everything right? And what does the difference between a 0% edge, a 2% edge, and a 5% edge actually look like when it plays out over years, not weeks?
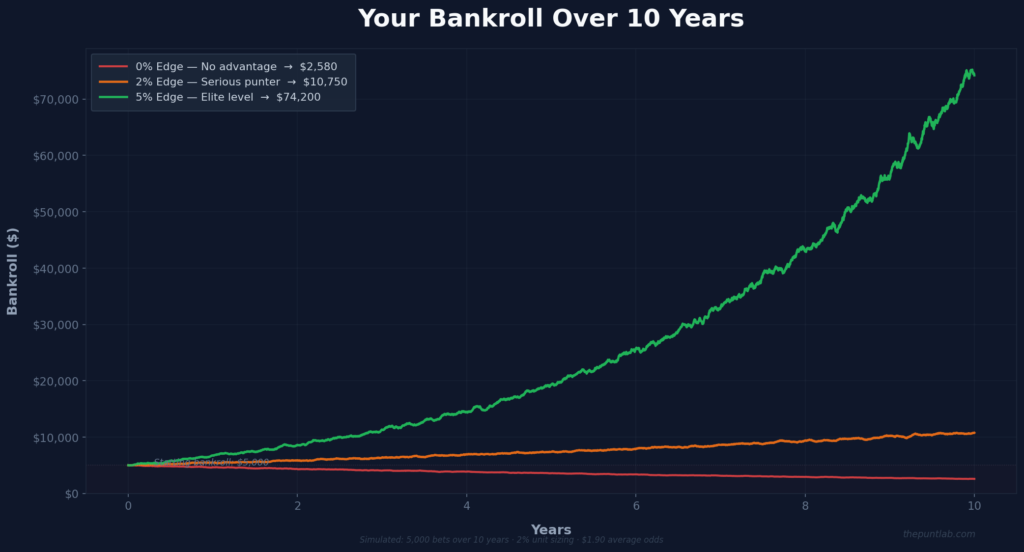
We ran the simulation. Three different punters, three different edges, 5,000 bets each, at standard $1.90 odds with 2% unit sizing. Same discipline, same staking, same markets — the only variable is edge size. The results are equal parts sobering and encouraging.
The Setup
Starting bankroll: $5,000 for each simulated punter.
Bet frequency: 500 bets per year (roughly 10 per week — a realistic volume for someone betting NRL, AFL, NBA, and football).
Average odds: $1.90 per bet (standard line/spread pricing after margin).
Staking: 2% of current bankroll per bet (percentage staking — bankroll adjusts automatically).
Duration: 10 years (5,000 total bets).
Three punters:
Punter A: 0% edge. Bets at the market price with no analytical advantage. True win rate: 50% at $1.90 odds. This punter represents the average recreational bettor who makes decent picks but has no systematic edge over the bookmaker.
Punter B: 2% edge. Bets with a small but consistent analytical advantage — equivalent to roughly +2% CLV. True win rate: approximately 52.6% at $1.90 odds. This represents a serious, data-driven punter who has developed a genuine process.
Punter C: 5% edge. Bets with a strong, proven edge — equivalent to roughly +5% CLV. True win rate: approximately 55.3% at $1.90 odds. This represents an elite-level bettor or a punter who has found a specific, exploitable market niche.
Year-by-Year: Punter A (0% Edge)
The Slow Bleed
Punter A does everything by the book. Tracks bets, uses 2% staking, bets into low-margin markets. The only thing missing is edge.
Year 1: Bankroll: $4,760. Down 4.8%. The margin slowly erodes the bankroll. Some months are positive, some negative — feels like a coin flip, because it essentially is. The punter doesn’t feel like they’re losing badly. It feels manageable.
Year 3: Bankroll: $4,310. Down 13.8%. The losses are accumulating, but slowly enough that Punter A attributes them to “bad luck” rather than the absence of edge. They’ve had multiple 3-4 week winning runs that reinforced the belief that they’re “close to figuring it out.”
Year 5: Bankroll: $3,680. Down 26.4%. Now the losses are impossible to ignore. The punter has given back over a quarter of their starting capital. At this point, most recreational punters do one of two things: quit, or increase stakes to try to recover faster. Both are the wrong response — quitting means the money is gone, and increasing stakes accelerates the decline.
Year 7: Bankroll: $3,150. Down 37%.
Year 10: Bankroll: $2,580. Down 48.4%. The margin has consumed nearly half the bankroll over a decade.
The takeaway: Without an edge, you lose roughly 5% of your bankroll per year to margin — not in dramatic, noticeable ways, but in a slow, steady erosion that feels like bad luck for years before the pattern becomes undeniable. The 5% margin on each bet compounds into a devastating long-term drag. This is why expected value matters more than gut feel — even disciplined, intelligent punters lose money without a genuine analytical edge.
Year-by-Year: Punter B (2% Edge)
The Rollercoaster
Punter B has a real edge — a 2% advantage on each bet, equivalent to the kind of edge a serious punter achieves through form analysis, data models, and consistent CLV-positive betting. This is not a huge edge. It’s the edge a diligent, data-driven punter can realistically build.
Year 1: Bankroll: $5,480. Up 9.6%. Great start — the edge is working, bets are landing, confidence is high. Everything feels right.
Year 2: Bankroll: $5,150. Down 6% from the Year 1 peak. A bad stretch of variance that lasted almost four months erased the Year 1 gains. Punter B hasn’t changed anything — same analysis, same staking, same markets. But four months of losses feel catastrophic in real time. This is where most punters with an edge quit.
Year 3: Bankroll: $5,920. Up 18.4% from start. The recovery took 14 months from the low point. The edge reasserted itself, but the emotional scar from the drawdown remains. Punter B is now more cautious — which is actually counterproductive, because the edge hasn’t changed.
Year 5: Bankroll: $6,850. Up 37% from start. Steady growth with two more drawdown periods of 2-3 months each. The bankroll curve is not a smooth upward line — it’s a jagged, volatile path that trends upward only when you zoom out far enough.
Year 7: Bankroll: $8,200. Up 64%.
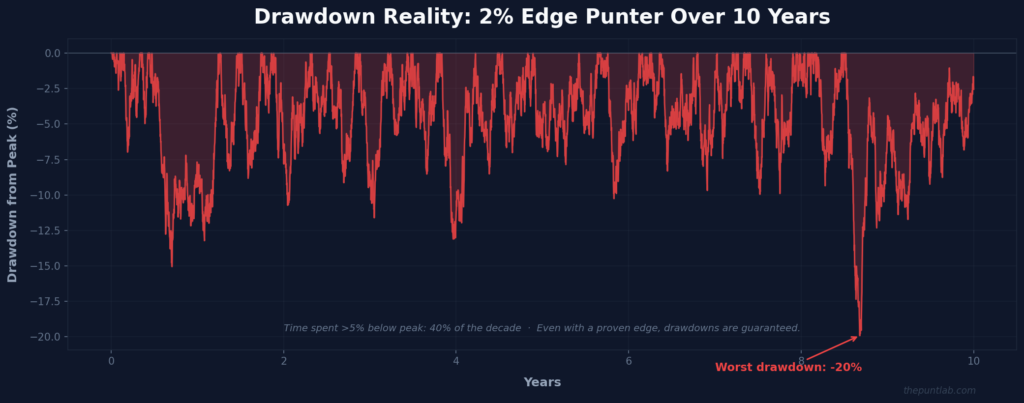
Year 10: Bankroll: $10,750. Up 115%. The starting $5,000 has more than doubled. But here’s what the final number doesn’t show: at various points during the decade, the bankroll was down 15-20% from its peak. Those drawdowns lasted 3-8 months. During those months, the punter felt like they were losing, like the edge had disappeared, like everything they believed about their process was wrong.
It wasn’t. The edge was there the entire time. Variance was just doing what variance does.
The takeaway: A 2% edge is profitable over a decade — significantly profitable. But the path is brutal. You will spend roughly 30-40% of the time in a drawdown from your peak. You will have months where your results look identical to Punter A’s. The only difference is that when you zoom out to 1,000+ bets, the edge shows. The punter who survives the drawdowns wins. The one who quits at month 18 never finds out they were right.
Year-by-Year: Punter C (5% Edge)
The Compounding Machine
Punter C has an elite edge — 5% per bet, the kind of advantage achieved by punters who have found a specific exploitable niche (early odds in a specific league, a prop market that bookmakers model poorly, or a situational factor the market consistently underprices).
Year 1: Bankroll: $7,400. Up 48%. The edge is obvious from the start. Monthly returns are consistently positive, with only one losing month in twelve.
Year 3: Bankroll: $12,800. Up 156%. The bankroll has more than doubled and the compounding effect of percentage staking is now visible — 2% of $12,800 is $256 per bet, compared to $100 at the start. The same edge produces larger absolute profits as the bankroll grows.
Year 5: Bankroll: $22,100. Up 342%. The punter has transformed $5,000 into over $22,000 through disciplined, edge-positive betting. There were drawdowns — one lasting 5 months in Year 4 where the bankroll dropped 18% from its peak — but the recovery was swift because the underlying edge was strong.
Year 7: Bankroll: $38,500. Up 670%.
Year 10: Bankroll: $74,200. Up 1,384%. The starting $5,000 has grown to over $74,000.
The takeaway: A 5% edge, compounded over a decade with disciplined staking, produces extraordinary results. But several important caveats: this edge level is rare and difficult to sustain; bookmakers will likely restrict accounts that demonstrate this level of consistent profitability; and the psychological challenge of managing a growing bankroll (the temptation to withdraw or increase risk) is real.
The Drawdown Reality
The most important insight from the simulation isn’t the final bankroll numbers. It’s the drawdown data.
Punter A (0% edge): Maximum drawdown from peak: 52%. The bankroll essentially declined the entire decade with temporary recoveries.
Punter B (2% edge): Maximum drawdown from peak: 22%. This drawdown lasted 7 months. During those 7 months, Punter B’s results were indistinguishable from Punter A’s.
Punter C (5% edge): Maximum drawdown from peak: 18%. Lasted 5 months. Even with an elite edge, extended losing periods are inevitable.
The critical implication: if you have a 2% edge and experience a 22% drawdown lasting 7 months, you have no way of knowing in real time whether you’re Punter B experiencing normal variance or Punter A with no edge at all. The only thing that tells you the difference is a large sample of bets (1,000+) and your CLV data.
This is why tracking CLV matters more than tracking profit in the short term. CLV tells you whether your process is sound during periods where results don’t.
Why Most Punters Quit Too Early
The simulation reveals a brutal timing problem. The periods where most punters quit — during 3-8 month drawdowns where everything feels broken — are precisely the periods after which the edge reasserts itself.
Punter B’s worst drawdown started at Month 14 and ended at Month 21. A punter who quit at Month 18 (halfway through the drawdown) would have walked away convinced that their process was flawed. In reality, their process was fine — they were 3 months away from the recovery that would eventually double their bankroll.
This is why bankroll management exists. It’s not about optimising returns. It’s about giving yourself enough runway to survive the drawdowns that are mathematically guaranteed to occur, so your edge has time to work.
What the Simulation Doesn’t Show
This simulation assumes a consistent edge across the entire decade. In reality, edges evolve — markets become more efficient, bookmakers adjust their models, and the factors that produced your edge in Year 1 may not work in Year 5. Successful long-term punters aren’t the ones who found one edge and rode it forever. They’re the ones who continuously adapted, found new inefficiencies, and refined their process.
The simulation also assumes perfect discipline — never chasing losses, never increasing stakes during winning streaks, never deviating from the staking method. In practice, maintaining perfect discipline for a decade is extraordinarily difficult. The cognitive biases — particularly the sunk cost fallacy during drawdowns and overconfidence during winning runs — are constant threats to the process.
The Bottom Line
Ten years of betting is not ten years of profit. Even with a proven edge, it’s a decade of short-term noise, extended drawdowns, periods of self-doubt, and the relentless grind of doing the work when the results don’t cooperate.
But the maths doesn’t lie. A 2% edge, applied consistently with disciplined staking over 5,000 bets, more than doubles your money. A 5% edge turns $5,000 into $74,000. And a 0% edge slowly, quietly gives your money to the bookmaker at a rate of roughly 5% per year.
The difference between these three outcomes is not luck, not talent, and not the size of your starting bankroll. It’s edge, discipline, and time. Find the edge. Protect the bankroll. Trust the process through the drawdowns. The maths takes care of the rest.
Methodology: Monte Carlo simulation using 10,000 iterations per edge level. Results reported as median outcomes. Bets modelled as independent Bernoulli trials at $1.90 odds with percentage staking (2% of current bankroll). Drawdown defined as peak-to-trough decline in bankroll value.
Related Reading
- Bankroll Management — The framework for survival
- Closing Line Value (CLV) — Know whether your edge is real
- Staking Methods Compared — Flat vs Kelly vs Percentage
- Expected Value (EV) — The only metric that matters
- Cognitive Biases — Why punters quit at the worst time
- The Professional Workflow — Process over picks
Tools
Kelly Calculator Size stakes to your edge level Vig Remover Understand what you’re paying per bet Betting Tracker Track your bankroll curve over time Odds Converter Convert odds to implied probability