Speed maps aren’t guesswork. They’re built on data — historical race performances, jockey tendencies, track conditions, and pace predictions all fed into a model that tells you where each horse is likely to sit in the run.
If you haven’t read our intro guide yet, start with Speed Maps Explained: A Beginner’s Guide before diving into this one.
Historical Data: The Foundation
Every speed map starts with past performances. Analysts pull apart a horse’s previous races — where it sat at the 400m, the 800m, the turn. Was it leading? Midfield? Last? Over enough races, a pattern emerges. That pattern is the horse’s natural running style, and it’s the single most reliable predictor of where it’ll sit next start.
Jockey Tactics
Jockeys aren’t passengers. Their instructions change everything. A frontrunner under a hold-up jockey becomes a midfield runner. A closer under an aggressive rider might press forward earlier than expected. Speed map analysts factor in each jockey’s tendencies — who likes to lead, who sits and waits, who rides the rail.
Track Conditions
A horse that dominates on firm ground can be useless on a Heavy 10. Speed maps account for this by adjusting predicted positions based on how each runner handles different surfaces. Track bias matters too — some venues consistently favour leaders, others reward backmarkers. Ignore track conditions and your speed map is just decoration.
Race Dynamics
The hardest part: predicting how the race will actually unfold. How many genuine leaders are in the field? Will there be a speed battle up front, burning out the pace? Or will one horse roll along unchallenged on the lead?
A race with three or four on-pacers will typically run fast early, setting it up for closers. A race with one clear leader and a bunch of backmarkers? That leader might pinch it on the front end. This is where the real edge lives.
How to Read a Speed Map
Understanding the symbols and positions is one thing. Turning that into a bet is another. Here’s how to actually use what the map is telling you.
1. Identify the Tactical Advantage
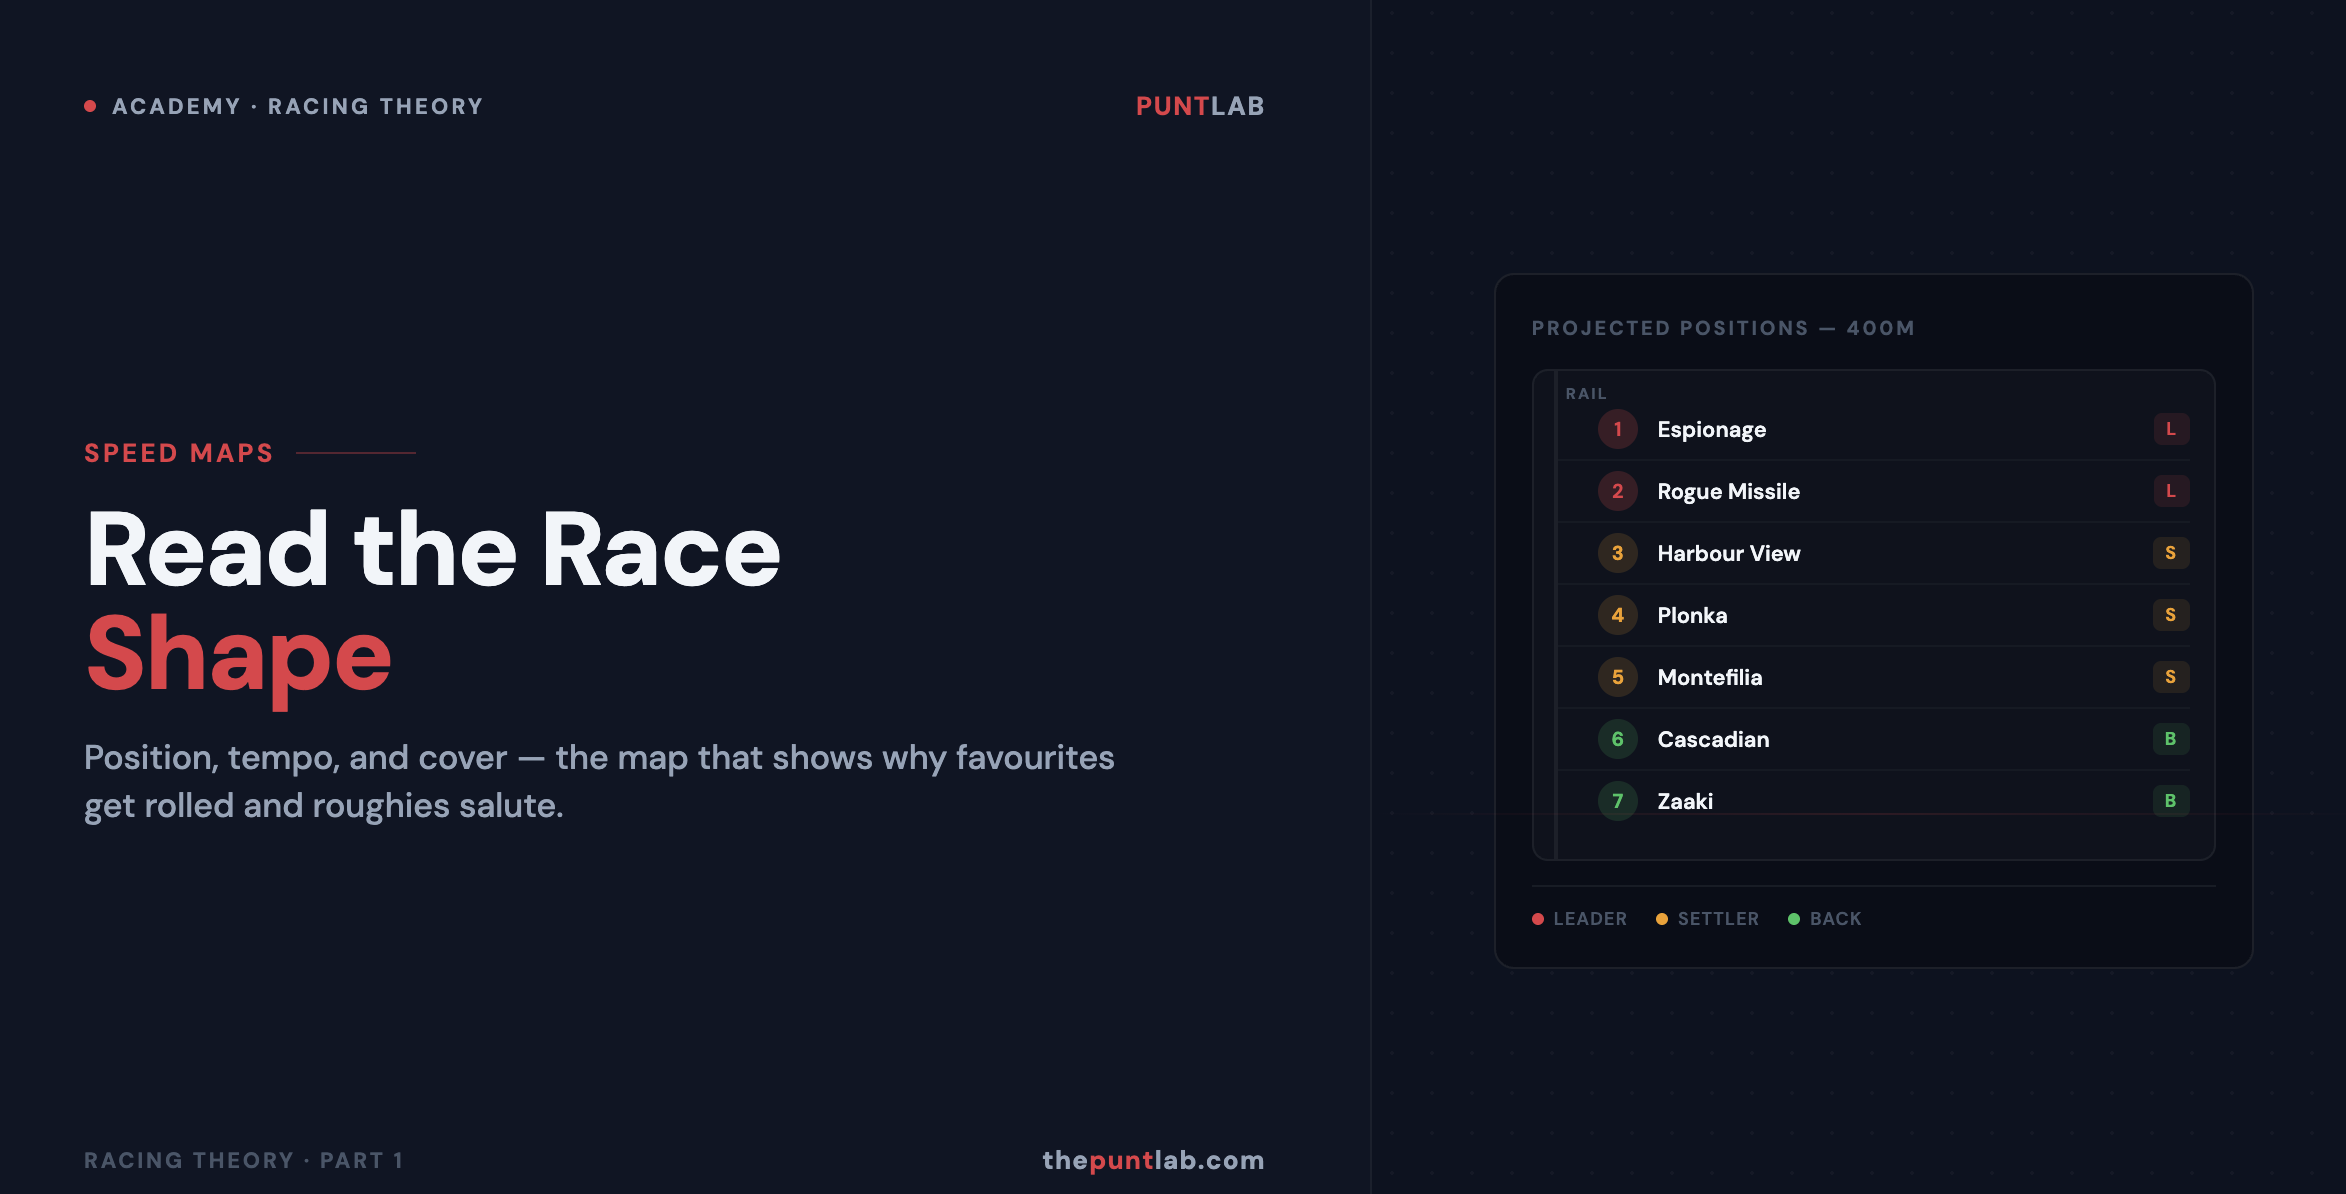
Look for horses marked as leaders (L) or settlers (S) that suit the expected race dynamics. If you’re expecting a genuinely run race with solid early speed, backmarkers and midfield runners come into play. If there’s no speed in the race, the leader has a massive advantage — it’ll roll along at its own tempo and take some catching.
2. Assess the Race Tempo
This is the most important step. Count the genuine leaders in the field.
One leader with no pressure = slow tempo = back the leader or on-pace runners.
Three or four leaders = fast tempo = back the closers who’ll storm home over the top.
Get the tempo wrong and everything else falls apart.
3. Inside vs Outside Position
On tight tracks, barrier draw is king. Inside runners (I) save ground on the turns. Outside runners (O) cover extra metres every time the field wheels. On a 1200m race at a tight track, an outside draw can cost a horse two or three lengths. That’s the difference between winning and running fourth.
4. Pattern Recognition
Look at a horse’s last five runs. Does it consistently lead? Always settle midfield? Or does it mix it up depending on the draw and the pace? Horses that show a consistent pattern are easier to map. Versatile runners — the ones that can lead or settle — are harder to predict but often more dangerous.
Strategies for the Speed Map Punter
Pick Your Races
Not every race is worth betting on. Speed maps are most useful when the pace scenario is clear — one or two obvious leaders, or a field stacked with speed. Avoid races where the pace is a coin flip. Those are the ones that’ll burn your bankroll.
Match Your Bet Type to the Map
In races with a strong predicted pace and a clear closer, exotic bets like trifectas work well — put the closers on top and the spent leaders underneath. In races where the leader looks unbeatable, back it on the win and save the exotics for a better race.
Combine with Form
A speed map tells you where a horse will be. Form tells you whether it’s good enough to win from there. Use both. A horse with the perfect map position but terrible recent form is still a bad bet. A horse with great form stuck three-wide without cover the whole way? Also a bad bet. You need both pieces of the puzzle.
Watch for Track Bias
Check the day’s results before your race. If every winner has led or sat on-pace, the track is playing to speed. If closers are running over the top all day, adjust your speed map read accordingly. Track bias can override everything else.
Ready for the advanced stuff? In Part 2 we get into the mathematics — velocity calculations, algorithms, and how to build your own predictive models.
Explore more betting education in the Betting Academy →