Corner kicks are one of the most underanalysed areas in football betting. The match result market gets the attention, the goals market gets the models, but the corner market — which exists at every major bookmaker — is often priced with less sophistication and less data than almost any other football market.
That inefficiency is the edge. And it’s more accessible than most punters think.
How the Corner Market Works
Most bookmakers offer corner totals (Over/Under a set line, usually between 8.5 and 12.5), team corner totals, Asian corner lines, and sometimes corner match bets (which team wins more corners). The most liquid market is the total corners Over/Under line.
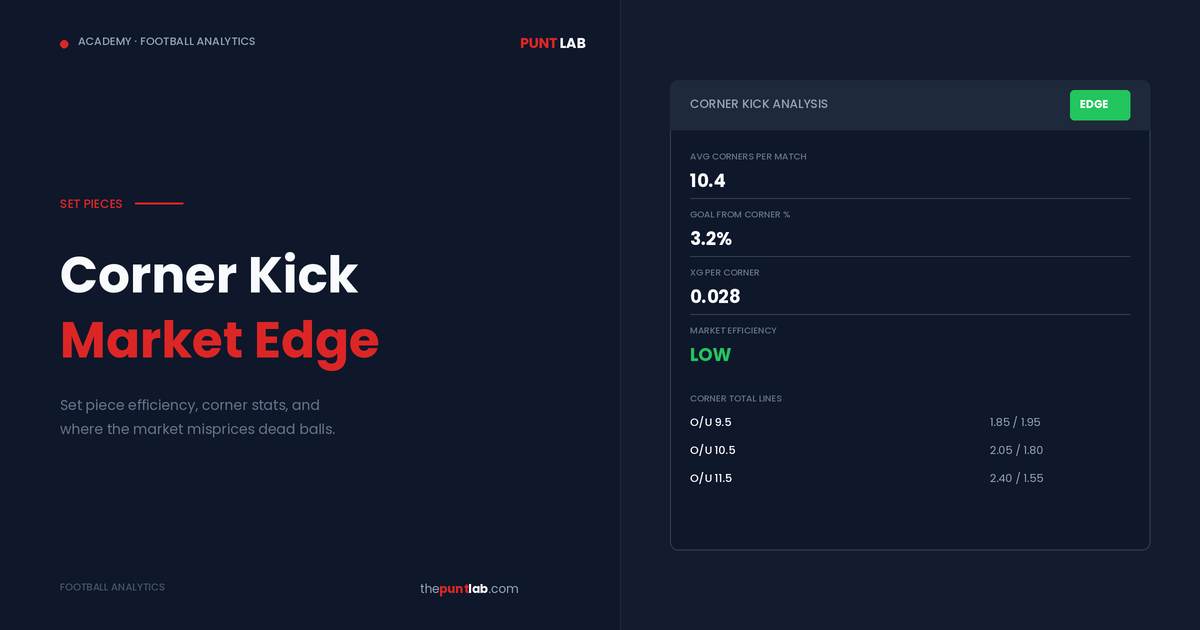
The mechanics are identical to goals Over/Under: the bookmaker sets a line based on expected corner totals, and you bet on whether the actual number will be higher or lower. A typical Premier League match produces around 10-11 total corners, so the standard line sits around 9.5 or 10.5.
What makes corners different from goals is the frequency. A match with 0-1 goals is common; a match with 0-1 corners essentially never happens. This higher frequency means corner totals have lower variance than goal totals, which in theory makes them more predictable — and more exploitable when the bookmaker’s model is weak.
Why Corner Markets Are Inefficient
Less Modelling, More Guesswork
Bookmakers invest heavily in modelling goal markets — they use xG data, Poisson distributions, team ratings, and sophisticated pricing engines. Corner markets receive a fraction of that attention. Many bookmakers price corners using relatively simple formulas based on team averages, without accounting for the tactical factors that actually drive corner counts.
This creates pricing gaps that don’t exist in the more heavily modelled markets.
Lower Liquidity Means Slower Line Movement
Corner markets attract less money than goals or match result markets. Lower liquidity means less sharp money flowing in to correct mispricing. In a goals market, a bookmaker’s price error gets arbitraged away within minutes by professional bettors. In a corner market, that same error can sit uncorrected for hours.
Tactical Factors Are Underweighted
Corner counts are heavily influenced by tactical matchups — specifically, the interaction between how one team attacks and how the other defends. A team that plays with wide wingers and crosses frequently will generate more corners than a team that plays through the centre. A team that defends deep and blocks crosses will concede more corners than a team that presses high and wins possession before the ball reaches wide areas.
These tactical patterns are consistent and measurable, but they’re not always reflected in the odds.
What Drives Corner Counts
1. Attacking Style — Width and Crossing
Teams that attack down the flanks generate more corners than teams that play through the middle. This is intuitive — a cross that gets blocked by a defender becomes a corner. A through ball that gets intercepted in the centre doesn’t.
Look at the team’s crossing frequency, wide play percentage, and shots from outside the box. Teams that shoot from distance and play wide are corner generators.
2. Defensive Style — Block Rate and Low Block
The defending team’s approach is equally important. Teams that sit deep and defend in a low block will concede more corners because they’re positioned near their own goal line, and blocked shots and crosses are more likely to deflect behind.
Teams that press high and win the ball in the opponent’s half concede fewer corners because the ball rarely reaches dangerous wide positions.
3. Match State — Trailing Teams Push Forward
Corners are strongly correlated with match state. When a team is trailing, they push players forward, attack more aggressively, and generate more corners (and concede fewer) than when they’re leading or drawing. If you expect a lopsided match where one team will likely trail for long periods, the total corner count often increases because the losing side generates corners through desperate attacking play.
This creates an interesting dynamic: matches where one team is a heavy favourite often produce more corners than matches between evenly matched sides, because the trailing team spends longer in an attacking posture.
4. Referee Tendencies
This is the factor that almost nobody accounts for. Different referees have measurably different average corner counts in their matches. This isn’t because referees award corners differently — it’s because refereeing style affects the flow of the match, the number of stoppages, and the tactical approach of both teams. A referee who lets the game flow tends to produce more open play and more corners. A referee who stops play frequently disrupts attacking momentum.
The referee appointment is usually confirmed 2-3 days before a match. Checking the referee’s average corner count across their matches this season is a simple edge that most punters ignore entirely.
Goals from Corners: The Scoring Angle
Only about 3-4% of corners result directly in a goal. That sounds low, but over a match with 10-11 corners, it means roughly one corner per three matches leads to a goal. In BTTS and goals markets, set piece efficiency can be the difference between a 1-1 and a 1-0.
Teams with tall, physical players and well-rehearsed set piece routines convert corners at significantly higher rates. If a team scores from 6% of their corners (double the average), that’s a meaningful edge in goals markets — especially when the bookmaker’s model uses league-average corner conversion rates.
Conversely, teams that are poor defensively from set pieces — conceding goals from a higher percentage of corners faced — are vulnerable in ways that the standard xG models often miss, because xG typically focuses on open-play chance creation.
Practical Framework for Corner Betting
Step 1: Check both teams’ average corners for and against on the season. Home/away splits matter here — teams typically win more corners at home.
Step 2: Assess the tactical matchup. Is the attacking team a wide, crossing side? Is the defending team a low block? If both answers are yes, corners are likely to be above the line.
Step 3: Check the referee assignment. Look at the average total corners in that referee’s matches this season. If they’re consistently 1-2 corners above or below the league average, adjust your expectation accordingly.
Step 4: Consider the likely match state. If one team is a heavy favourite, the trailing team will push forward late and generate additional corners. Factor this asymmetry into your total.
Step 5: Compare your estimated total to the bookmaker’s line. Convert the odds to implied probability, strip the vig, and assess whether you have a genuine edge.
Common Mistakes in Corner Betting
Using Overall Averages Without Context
A team that averages 6 corners per match sounds straightforward. But if that average includes 3 matches where they had 10+ corners (because they were trailing and pushing forward) and 5 matches where they had 3-4 (because they led early and sat back), the average is misleading. Match state context matters more than the raw average.
Ignoring the Opponent Entirely
Corners are a product of both teams’ styles. A high-corner team against a high-pressing opponent will produce fewer corners than the same team against a deep-sitting defence. Always assess the matchup, not just the individual team averages.
Overreacting to One Match
Corner counts are volatile on a match-by-match basis. A team might have 12 corners one week and 3 the next. Single-match data is noise. Look at 5-10 match rolling averages and tactical patterns rather than last week’s number.
The Bottom Line
Corner markets exist in a sweet spot: enough data to build a genuine analytical edge, but not enough market efficiency to price that edge away. The factors that drive corner counts — attacking width, defensive depth, match state, referee tendencies — are measurable and predictable, yet many bookmakers don’t model them with the same rigour they apply to goals markets.
That gap between what the data tells you and what the market charges you is where the profit lives.
Related Reading
- Over/Under 2.5 Goals — The cousin market where set pieces matter
- What Is BTTS? — How set piece goals affect Both Teams to Score
- Expected Goals (xG) Strategy — Open-play xG vs set piece xG
- Market Percentages (The Vig) — Stripping margin to find true value
- Understanding Betting Odds — Converting odds to probability
Tools
- Vig Remover Calculator — See the true price behind corner markets
- Odds Converter — Convert between odds formats
- Free Betting Tracker — Track your corner bets separately from other markets