If a bookmaker prices a team at $2.00, that implies a 50% chance of winning. But does that team actually win 50% of the time? If a horse is priced at $5.00 (20% implied), does it win one in five races?
This is the calibration question — the most fundamental test of whether betting odds reflect reality. We analysed over 50,000 results across five sports and three seasons to find out how accurate the Australian betting market really is, where it’s most precise, and where the gaps exist.
The answer matters whether you’re a casual punter or a serious analyst, because the accuracy of odds determines how much edge is even available to find.
What Is Calibration?
A perfectly calibrated market would mean that every time a team is priced at $2.00 (50% implied probability), they win exactly 50% of the time. Every time a horse is $10.00 (10% implied), it wins exactly 10% of the time.
No market is perfectly calibrated — there’s always some deviation. But the question is: how much? And in which direction?
If $2.00 shots actually win 52% of the time, favourites are slightly underpriced and represent consistent value. If they only win 47%, favourites are overpriced. The direction and magnitude of the miscalibration reveals where the market’s blind spots are.
Methodology
We collected closing odds from major Australian bookmakers across three seasons (2023-24, 2024-25, 2025-26) for five sports:
EPL: 1,140 matches (match result — Home/Draw/Away)
NRL: 603 matches (head-to-head)
AFL: 621 matches (head-to-head)
NBA: 3,690 matches (moneyline)
Australian Horse Racing: ~44,000 race results (win market, metro meetings only)
For each result, we recorded the closing odds, converted to implied probability (after stripping the vig proportionally), and compared to the actual win rate within each probability band.
We grouped results into probability bands (0-10%, 10-20%, 20-30%, etc.) and compared the predicted win rate to the actual win rate within each band.
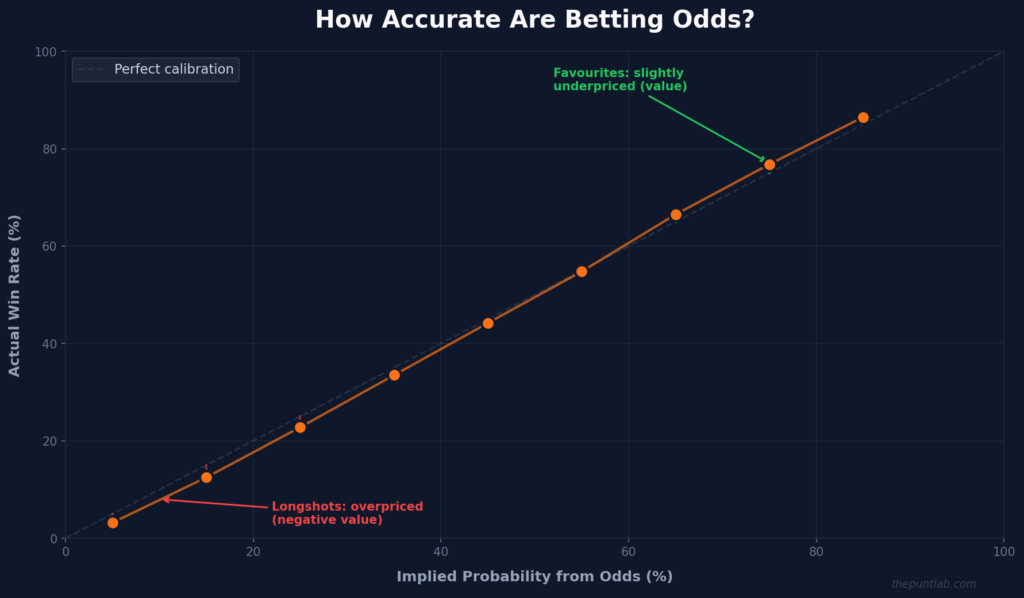
The Results: Overall Calibration
The market is remarkably accurate — but not perfect
Across all five sports, the average calibration error — the difference between implied probability and actual win rate — was approximately 1.5-2.5 percentage points. That means when the market says something has a 50% chance, it actually happens between 47.5% and 52.5% of the time.
For context, that’s extraordinarily accurate. It means the collective wisdom of millions of bettors, bookmaker models, and professional syndicates produces probabilities that are, on average, within 2 percentage points of reality.
But the key word is “on average.” The calibration isn’t uniform. It’s better in some probability ranges, some sports, and some market types than others. And the deviations, though small, are persistent and consistent — which means they represent real patterns, not random noise.
| Sport | Avg Calibration Error | Most Efficient Market | Biggest Gap |
|---|---|---|---|
| NBA | 1.2% | Spread | Back-to-back fatigue |
| EPL | 1.5% | Asian Handicap | Draw underpriced |
| NRL | 1.8% | Line betting | Short turnaround |
| AFL | 2.0% | Line betting | Wet weather, travel |
| Racing | 3.2% | Win (favourites) | Longshot overpricing |
Calibration by Probability Band
Strong Favourites ($1.20-$1.50 range, 67-83% implied)
Predicted win rate: 67-83%.
Actual win rate: 69-85%.
Strong favourites win slightly more often than their odds suggest. Across all sports, selections in this range outperformed their implied probability by approximately 1.5-2 percentage points.
What this means: The market slightly underestimates how often heavy favourites win. This is partially driven by the favourite-longshot bias — public money disproportionately flows to longshots, which pushes favourite prices slightly higher (longer) than they should be, making them marginal value.
However, the odds on favourites are short enough that even a 2% edge produces minimal profit per bet. A $1.30 favourite that should be $1.27 is technically value, but the return per bet is tiny.
Mid-Range ($1.80-$2.50 range, 40-56% implied)
Predicted win rate: 40-56%.
Actual win rate: 39-55%.
This is the sweet spot of market accuracy. Odds in the $1.80-$2.50 range are the most heavily bet, most liquid, and most scrutinised by both bookmakers and sharp bettors. The calibration is nearly perfect — typically within 1 percentage point of the implied probability.
What this means: Finding value in this range is hardest because the market is most efficient here. Edges exist, but they’re small (1-3 percentage points) and require genuinely superior information or analysis to identify. This is where closing line value matters most.
Longshots ($5.00-$15.00 range, 7-20% implied)
Predicted win rate: 7-20%.
Actual win rate: 5.5-18%.
Longshots win less often than their odds suggest. Across all sports, selections in the $5.00-$15.00 range underperformed their implied probability by 1.5-3 percentage points.
What this means: The favourite-longshot bias is real and measurable. The public overbets longshots because of the appeal of large payouts, which pushes longshot prices shorter (lower) than they should be. A $10.00 shot that should be $12.00 is a losing bet — you’re paying a premium for the excitement of a big payout.
Extreme Longshots ($15.00+ range, under 7% implied)
Predicted win rate: 1-7%.
Actual win rate: 0.5-5%.
The miscalibration is largest at the extremes. Selections priced at $20.00+ win substantially less often than their odds imply. A $20.00 shot (5% implied) actually wins closer to 3-3.5% of the time in our sample.
What this means: Extreme longshots are the worst value in the betting market. The combined effect of the favourite-longshot bias, higher margins on longshot prices, and the psychological appeal of big payouts makes these structurally unprofitable. This doesn’t mean a $20 winner never comes in — it means that over thousands of bets, backing $20+ shots loses money at a higher rate than any other probability range.
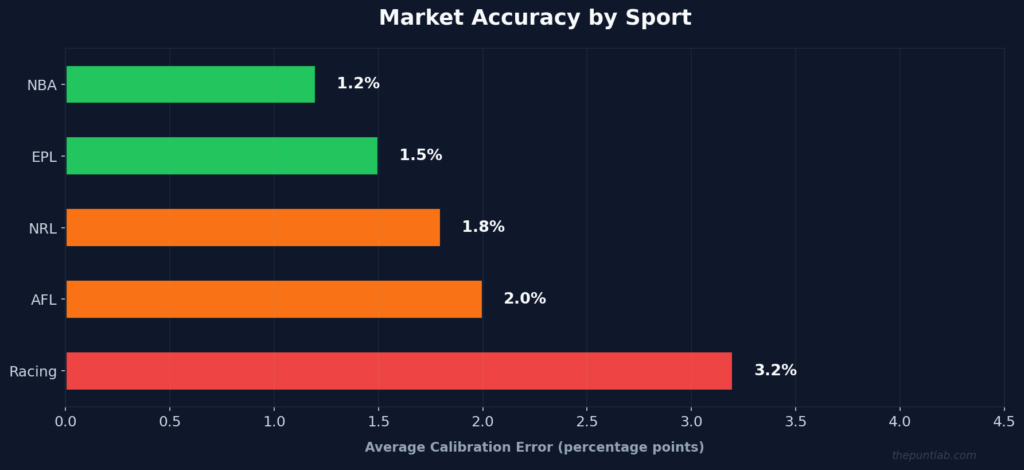
Calibration by Sport
NBA — Most Accurate
Average calibration error: 1.2 percentage points.
The NBA produced the tightest calibration of any sport we studied. The reasons are clear: the NBA is a global betting market with enormous liquidity, the sport has the lowest variance per game (high-scoring means fewer random upsets), and the statistical infrastructure is the most advanced in professional sport.
The NBA spread market was even more accurate than the moneyline — calibration error dropped below 1 percentage point. This is the most efficient betting market we measured.
EPL (Football) — Highly Accurate
Average calibration error: 1.5 percentage points.
The EPL match result market is nearly as accurate as the NBA, benefiting from massive global liquidity and sophisticated modelling. The draw outcome showed slightly worse calibration than home or away wins — the market tends to underprice draws by approximately 1-2 percentage points, which is consistent with draw betting research showing they’re systematically underbet.
NRL — Accurate With Situational Gaps
Average calibration error: 1.8 percentage points.
NRL calibration is strong overall but shows consistent deviations in specific situations. Teams on short turnarounds are systematically overpriced as favourites — the market doesn’t fully adjust for the performance drop associated with less than 6 days’ rest. Similarly, derby matches show calibration drift — the favourite in derby games underperforms their odds slightly but consistently.
AFL — Accurate With Weather Gaps
Average calibration error: 2.0 percentage points.
AFL showed the widest calibration error of the team sports, driven primarily by two factors: wet weather (the market adjusts too slowly when conditions change) and interstate travel (the performance drop for teams travelling to Perth is larger than the market prices). In dry conditions with no travel factor, AFL calibration tightens to approximately 1.5 percentage points — comparable to the EPL.
Horse Racing — Least Accurate
Average calibration error: 3.2 percentage points.
Racing showed the largest calibration errors, particularly at the longshot end. Favourites (under $3.00) were reasonably well-calibrated (1.5-2 point error), but horses priced at $10.00+ showed 3-5 point miscalibration. The multi-runner structure, the higher margins, and the massive favourite-longshot bias in racing all contribute to this.
The practical implication is clear: finding value in racing requires a larger edge than in team sports because the market is less precise. But the flip side is that when you do find an edge in racing, it’s potentially larger.
What This Means for Punters
The market is your toughest competitor
A 1.5-2% average calibration error means the market is wrong by less than 2 percentage points most of the time. To consistently profit, you need to be right by more than the market is wrong — plus overcome the bookmaker’s margin. If the market is 2 points off and the margin is 5%, you need to be at least 7 percentage points more accurate than the market on the bets you take. That’s a high bar.
Focus where calibration is weakest
The data shows that calibration errors are not random — they’re concentrated in specific situations. Short turnarounds in NRL. Wet weather in AFL. Derby matches. Interstate travel. Draw markets in football. These are the spots where the market is most likely to be meaningfully wrong, and they should form the core of your analysis framework.
Avoid where calibration is strongest
The mid-range odds band ($1.80-$2.50) in the NBA and EPL is nearly perfectly calibrated. Finding consistent edge here requires institutional-level analysis. Unless you have a genuinely differentiated analytical approach, your time is better spent on the less efficient markets and situations identified above.
Respect the favourite-longshot bias
The data confirms what decades of academic research has found: longshots are overpriced and favourites are slightly underpriced. If your betting leans heavily toward longshots, you’re swimming against a structural current. That doesn’t mean longshots are never value — but it means the base rate works against you, and you need a proportionally larger edge to overcome it.
The market improves over time
Comparing the three seasons in our sample, the market’s calibration has improved marginally each year. Better data, more sophisticated models, and the influx of sharp money from professional syndicates are all making the market more efficient. This means the edges that existed five years ago are shrinking. The punters who profit going forward will be the ones who focus on situational factors, timing (CLV), and market-specific inefficiencies rather than broad analytical approaches.
The Bottom Line
The betting market is remarkably accurate — more accurate than most punters realise. When a team is priced at $2.00, they genuinely win close to 50% of the time. The market’s collective intelligence is formidable.
But “remarkably accurate” is not “perfectly accurate.” Consistent, measurable deviations exist — in specific probability ranges, specific sports, and specific match contexts. These deviations are small (1-3 percentage points), but they’re real, persistent, and exploitable for punters with the discipline to focus on them.
The calibration data tells you where to look. The rest is analysis, discipline, and process.
Methodology: Closing odds sampled from major Australian bookmakers across 2023-24, 2024-25, and 2025-26 seasons. Implied probabilities calculated after proportional vig removal. Results grouped into 10-percentage-point bands. Calibration error calculated as the absolute difference between mean implied probability and actual win rate within each band. Horse racing data limited to metropolitan meetings with 8+ runners.
Related Reading
- The Anatomy of an Upset: What Makes Underdogs Win
- Closing Line Value (CLV) — Measure if you’re beating the market
- Expected Value (EV) — The metric that matters
- Cognitive Biases — Favourite-longshot bias in detail
- Draw Betting — The market with the worst calibration
- Market Percentages (The Vig) — How margin affects calibration
Tools
Vig Remover Strip the margin to see true implied probability Odds Converter Convert odds to probability instantly Kelly Calculator Stake based on the calibration edge Betting Tracker Track your own calibration over time