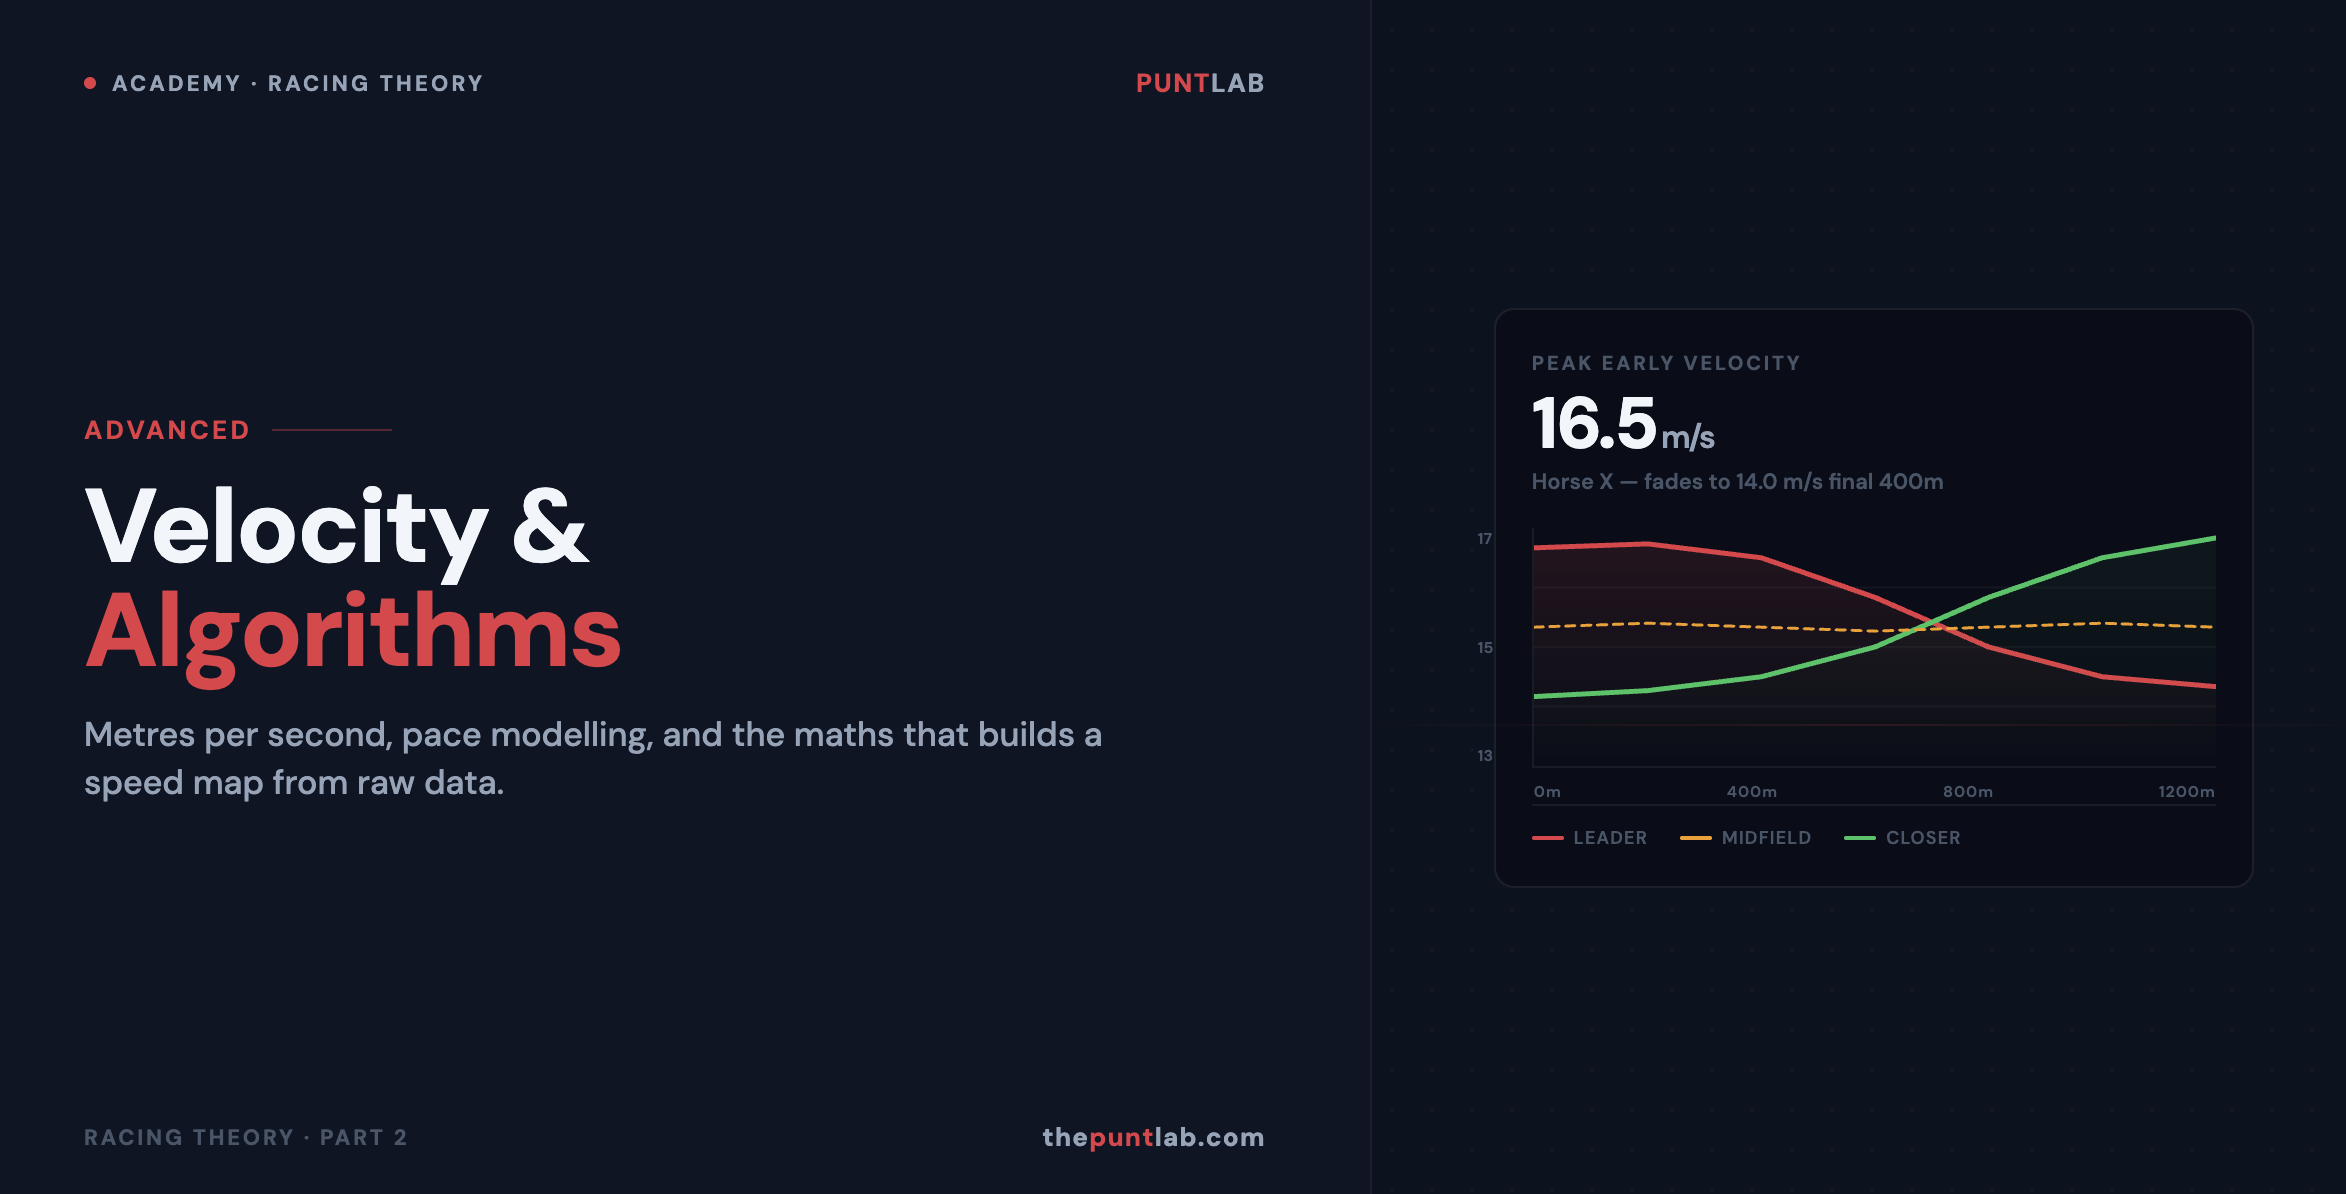
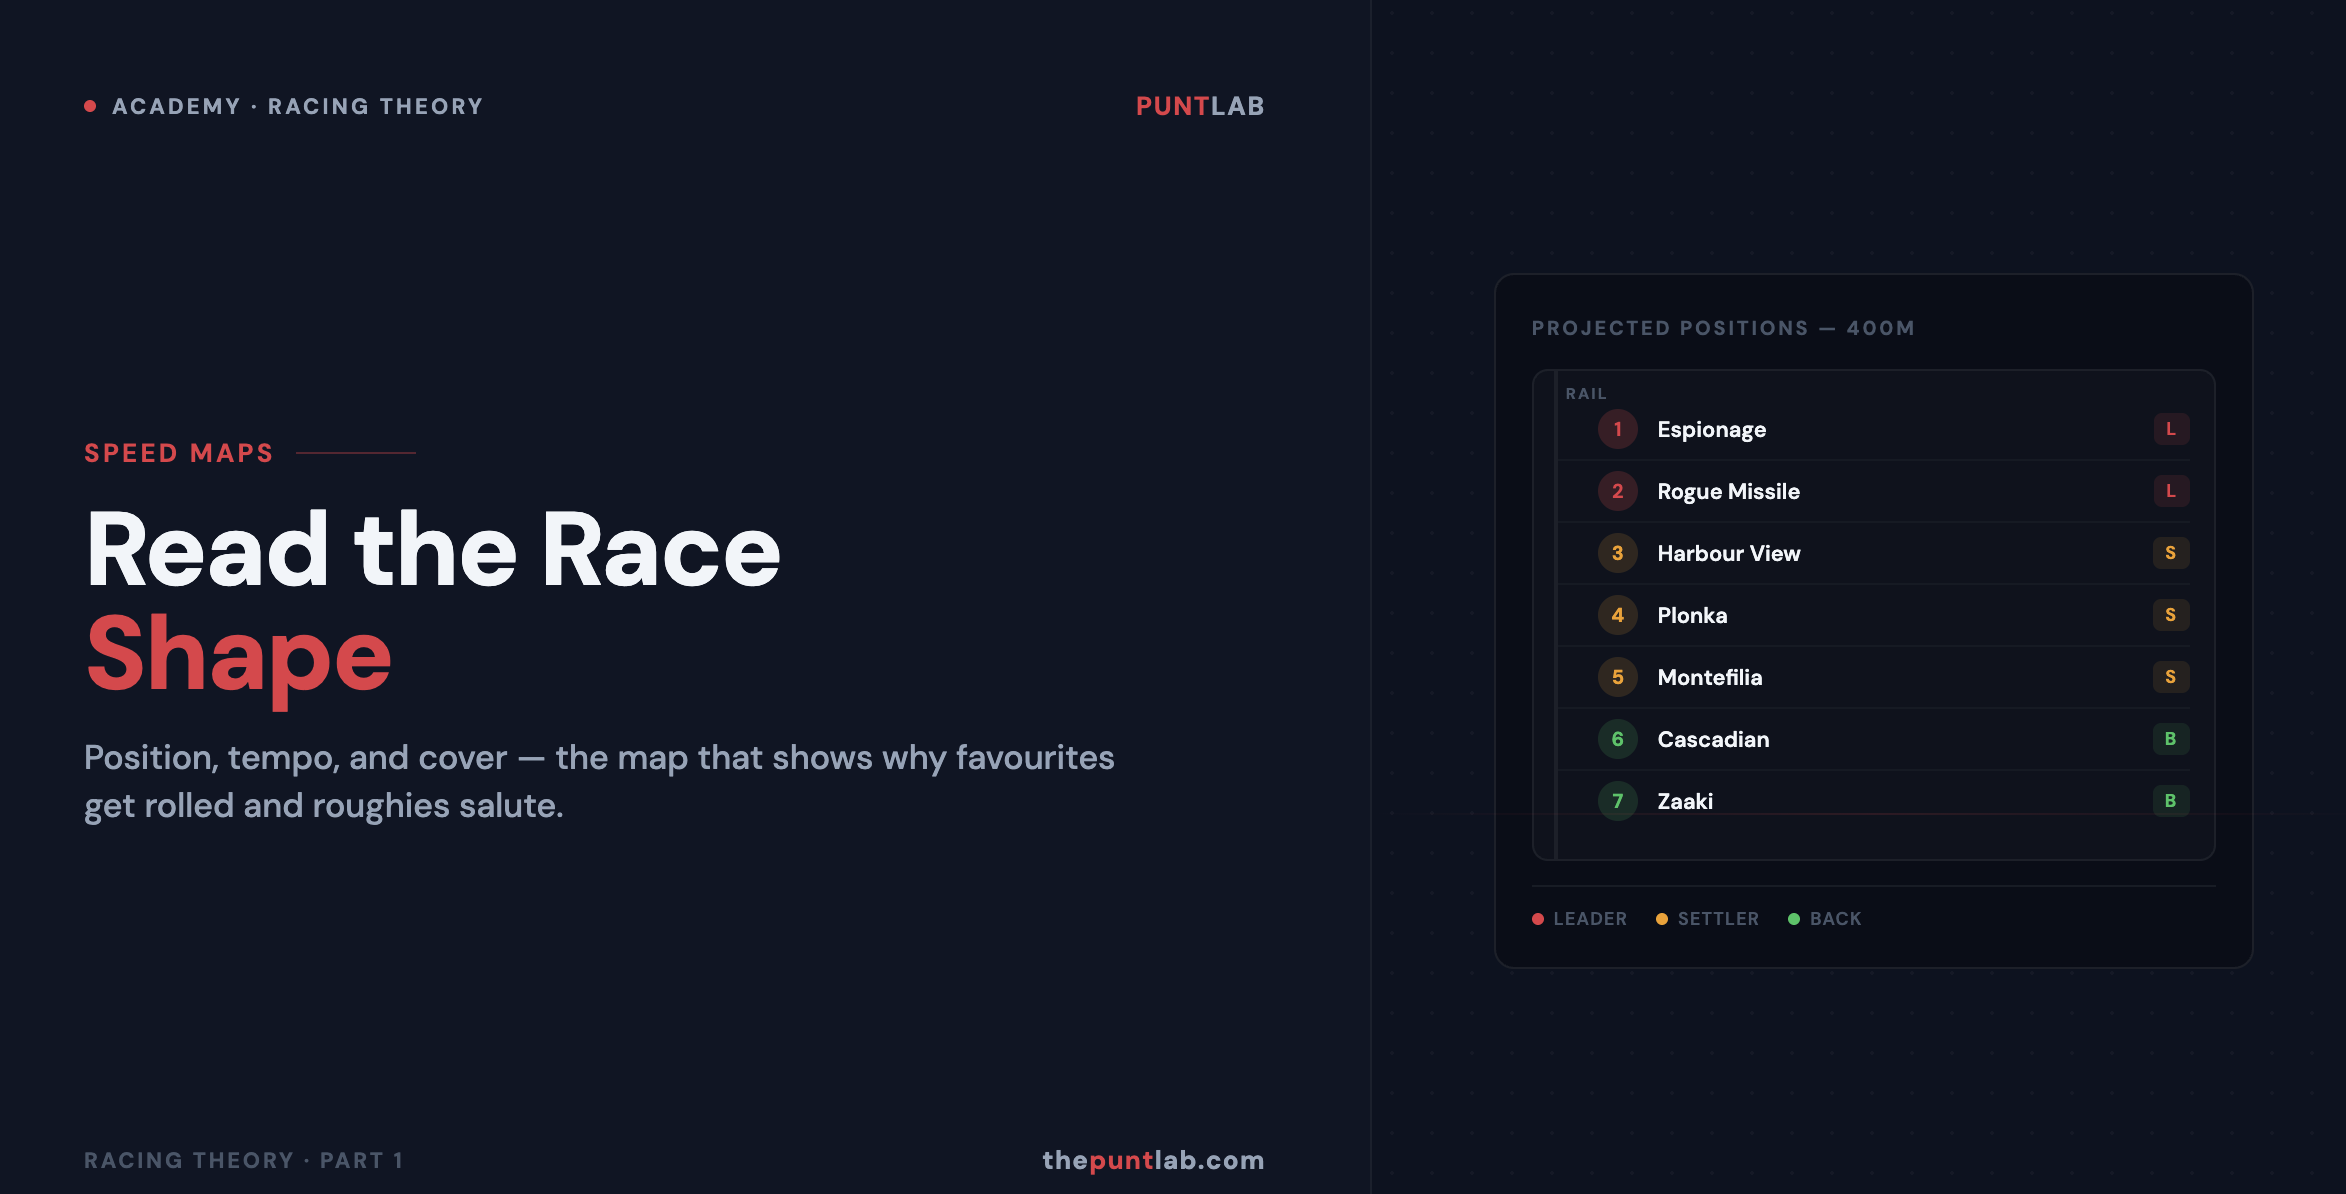
Speed maps aren’t guesswork. They’re built on data — historical race performances, jockey tendencies, track conditions, and pace predictions all fed into a model that tells you where each horse is likely to sit in the run. If you haven’t read our intro guide yet, start with Speed Maps Explained: A Beginner’s Guide before diving … Read more
Racing Theory
Speed maps, sectional analysis, and form study techniques for thoroughbred racing.
Racing Theory
Speed maps, sectional analysis, and form study techniques for thoroughbred racing. Learn how to read race data beyond finishing positions and margins.
If Part 1 was about reading the map, Part 2 is about building one. This is where speed maps stop being a visual guide and start becoming a mathematical model. Every serious speed map is a probability exercise. It’s not just “Horse A is fast.” It’s: what’s the probability Horse A leads given the speed … Read more
What Is a Form Guide? A form guide is a horse’s resume. It shows every recent run — where they finished, what weight they carried, which jockey was on board, the track conditions, barrier draw, and starting price. It’s the single most important tool for any racing punter. Every horse in today’s race has a … Read more
In Australian racing, the best horse doesn’t always win — because races aren’t run in a vacuum. They’re won and lost through position, tempo, and how much petrol a horse burns before the 600m. A runner that finds the right spot and gets a soft run can beat a better horse that’s posted wide, trapped … Read more
Most punters judge a horse’s performance by two things: finishing position and margin. “Finished 6th, beaten 3 lengths” gets filed as an average run and forgotten. But that approach misses where the real edge lives — because racing results are shaped far more by tempo, positioning, and luck in running than most people realise. Sectional … Read more