Most punters judge performance by finishing position and margins. But that approach misses where the edge actually is — because racing results are heavily shaped by tempo, positioning, and luck in running.
Both Teams to Score — commonly shortened to BTTS — is one of the most popular football betting markets in the world, and for good reason. It strips away the complexity of predicting a winner and reduces the bet to a single question: will both sides find the net?
That simplicity is exactly what makes it appealing. But simplicity doesn’t mean easy. The BTTS market is one of the most misunderstood in football betting, and most punters approach it with gut feel rather than data. This guide will change that.
How BTTS Works
A BTTS bet has two outcomes: Yes or No.
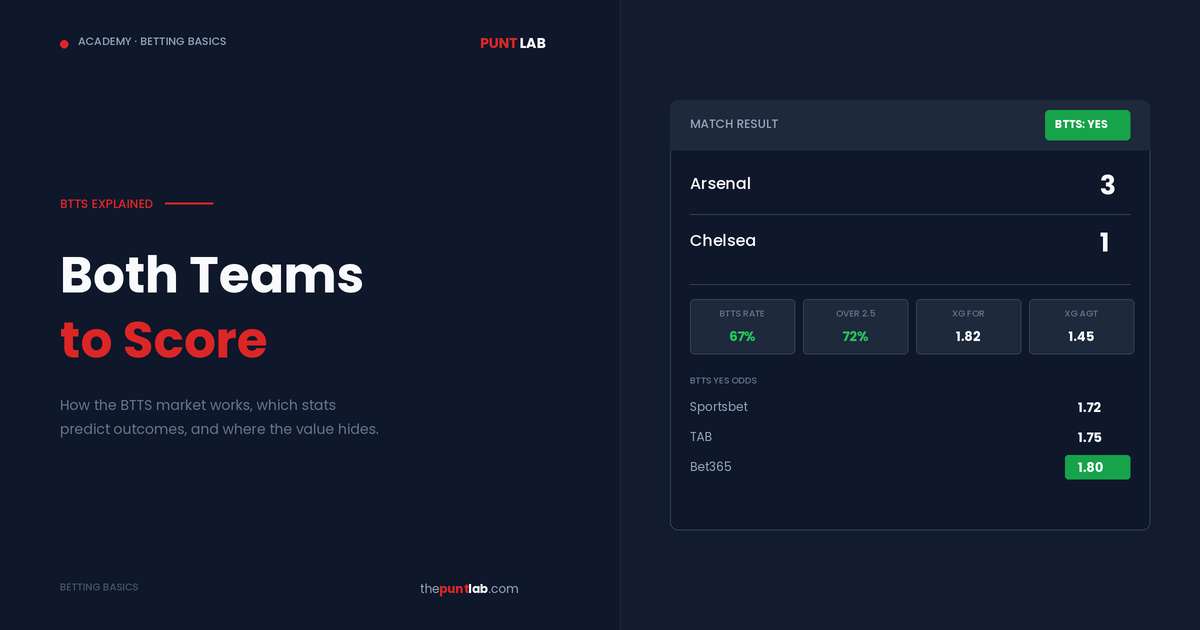
BTTS Yes wins if both teams score at least one goal during the match, regardless of the final result. A 1-1 draw, a 3-2 thriller, or a 4-1 blowout — all of these settle as BTTS Yes.
BTTS No wins if either team (or both) fails to score. A 1-0 win, a 2-0 win, or a 0-0 draw all settle as BTTS No.
The bet covers 90 minutes plus stoppage time. Extra time and penalties don’t count unless the bookmaker explicitly states otherwise.
Here’s the critical thing most punters miss: BTTS is completely independent of who wins. You can back BTTS Yes on a match where a heavy favourite wins 5-1, and you still collect. This independence from the match result is what creates the value opportunities.
How Bookmakers Price BTTS
Understanding how the odds are set is the first step toward beating them.
Bookmakers use a combination of historical data, team-level attacking and defensive metrics, and model-generated probabilities to estimate the likelihood of both teams scoring. They then apply their margin — the vig — to convert those probabilities into odds.
For example, if a bookmaker’s model says there’s a 55% chance both teams score, the “fair” odds would be 1.82 (1 divided by 0.55). But you won’t get 1.82. After applying a typical 5-6% margin, you’ll see something closer to 1.72 for BTTS Yes, while BTTS No might sit at 2.00. The combined implied probability exceeds 100% — that gap is the bookmaker’s profit. If you want to understand this margin in detail, our guide on Market Percentages (The Vig) breaks it down with examples, and you can strip the margin out yourself using our Vig Remover calculator.
The key insight is that BTTS pricing relies heavily on league-level and team-level scoring averages. When those averages lag behind reality — a team’s defence has quietly improved, or a key striker is injured — the odds can be slow to adjust. That’s where the edge lives.
What Stats Actually Predict BTTS Outcomes
This is where most guides stop being useful. They’ll tell you to “look at recent form” without telling you what to look at or why. Here are the metrics that actually matter, ranked by predictive value.
1. Expected Goals (xG) — Both Attacking and Defensive
Expected Goals measures the quality of chances created, not just whether they were scored. A team might have scored 3 goals in their last match, but if those came from low-quality chances (long-range efforts, deflections), it tells you very little about their ability to score consistently.
What you want is a team’s xG For (attacking output) combined with their opponent’s xG Against (defensive vulnerability). If Team A creates 1.8 xG per match on average and Team B concedes 1.5 xG per match, there’s a strong probability Team A will score. Run the same analysis in reverse for the other side.
If you’re not familiar with expected goals, our guide on How to Use xG to Find Value Winners covers the concept in full.
2. BTTS Hit Rate — Season and Recent
This is the most obvious metric and still worth tracking. Across the major European leagues, the season-long BTTS percentage typically falls between 48% and 58%, but it varies significantly by league and by team.
Some teams are “BTTS magnets” — they score regularly but also concede regularly. Others are defensive walls that rarely see both teams on the scoresheet. The season-long BTTS rate gives you the baseline; the last 5-10 matches show you the trend.
You can check the current BTTS percentages for every team across the Premier League, La Liga, Serie A, Bundesliga, and Ligue 1 on our Data Hub pages. These are updated automatically and show both home and away splits.
3. Clean Sheet Percentage
A team’s clean sheet rate is BTTS No’s best friend. If a team keeps a clean sheet in 45% of their matches, that single stat alone tells you BTTS No has a much higher probability when they’re involved.
Conversely, teams that almost never keep clean sheets — think of sides in a relegation battle that leak goals — are prime BTTS Yes candidates, especially when paired with another leaky defence.
4. Shots on Target For and Against
Goals are low-frequency events — a team might score 0, 1, or 2 goals in any given match regardless of how well they play. Shots on target are a higher-frequency proxy for attacking threat. A team averaging 5+ shots on target per match is far more likely to score than one averaging 2, even if their recent goal tallies are similar.
5. Scoring First Percentage
This one is underrated. If a team scores first in 60%+ of their matches, BTTS becomes more likely because the trailing team is forced to push forward, creating space for both sides to score. Conversely, if both teams in a fixture rarely score first, you’re looking at a match that might stay goalless for long stretches.
Common BTTS Mistakes
Chasing Odds Without Context
A BTTS Yes price of 1.55 might look like a “safe” bet, but if the true probability is only 58% (fair odds: 1.72), you’re actually laying terrible value. Always compare the implied probability of the odds to your data-driven estimate. Our Odds Converter calculator can help you quickly convert between decimal odds and implied probability.
Ignoring Team News
Injuries and suspensions can completely flip a BTTS assessment. If a team’s top scorer is out, their attacking xG drops. If their starting goalkeeper is injured, the opponent’s chance of scoring rises. Always check team news before placing a BTTS bet — this applies to every market, but BTTS is particularly sensitive because you need both sides to deliver.
Treating All Leagues the Same
League context matters enormously. The Bundesliga historically has the highest BTTS rate among the top five European leagues, often exceeding 55%. Serie A, traditionally more defensive, tends to sit lower. Applying a blanket “both teams usually score” assumption across all leagues will cost you money.
Over-Relying on Recent Results
A team might have seen BTTS land in 8 of their last 10 matches, but if their underlying xG numbers don’t support that rate, regression is coming. Goals are noisy. A team can overperform their xG for a few weeks, but over a full season, actual goals tend to converge with expected goals. Look at the xG, not just the scoreline.
BTTS and Parlays: A Word of Caution
BTTS is one of the most popular legs in multi-bet parlays (accumulators), and bookmakers love it when you combine them. Here’s why you should be careful.
Each BTTS leg in a parlay multiplies the bookmaker’s margin. If a single BTTS bet carries a 5% margin, a four-leg BTTS parlay doesn’t carry 20% — it compounds. By the time you’ve stacked four or five BTTS legs, you’re fighting a margin that makes long-term profit almost impossible unless every single selection has genuine value.
The smarter approach: if you’ve identified a BTTS selection with a genuine edge, bet it as a single. The returns are lower, but the probability of long-term profit is dramatically higher.
How to Use PuntLab’s Data for BTTS Betting
Every league page on PuntLab includes a Data Hub with the stats you need for BTTS analysis. Here’s a practical workflow:
Step 1: Check the team’s BTTS percentage on the relevant league Data Hub (Premier League, La Liga, Bundesliga, Serie A, Ligue 1).
Step 2: Cross-reference with the Over 2.5 Goals percentage. High Over 2.5% combined with high BTTS% confirms this is a high-scoring fixture profile, not a fluke.
Step 3: Read the match preview for the specific fixture. Our previews include team form, injury reports, and head-to-head records — all relevant to a BTTS assessment.
Step 4: Compare odds across bookmakers using our odds comparison tables to ensure you’re getting the best available price.
Step 5: Only bet if your data-driven probability exceeds the implied probability of the odds. If your analysis says 60% chance of BTTS Yes but the odds imply 62%, there’s no edge — pass and wait for the next one.
BTTS vs Over/Under 2.5 Goals
These two markets are closely related but not identical, and confusing them is a common mistake.
BTTS Yes requires both teams to score, but doesn’t require a specific number of goals. A 1-1 draw is BTTS Yes but Under 2.5 Goals. A 3-0 win is Over 2.5 Goals but BTTS No.
The correlation between the two is real — high-scoring matches tend to see both teams score — but it’s far from perfect. In practice, about 70-75% of matches that go Over 2.5 also see BTTS land, but that leaves a significant chunk where they diverge.
Understanding this distinction lets you pick the right market for the right situation. If you expect a one-sided high-scoring affair (say, a top team at home against a relegation side), Over 2.5 might be the better play than BTTS. If you expect a tight, competitive match where both sides will create chances, BTTS could be the sharper bet even if the total goals stay low.
The Bottom Line
BTTS is a genuinely useful market when approached with discipline and data. The teams that are BTTS magnets reveal themselves clearly in the statistics — high xG For, high xG Against, low clean sheet rates, high shots on target conceded. The edge comes from identifying these patterns before the bookmaker’s odds fully reflect them.
Stop guessing. Start with the data. The numbers are already on your screen — use them.
Related Reading
- Market Percentages (The Vig) — Understand how bookmakers build their margin
- How to Use xG to Find Value Winners — The stat that powers modern football analysis
- Understanding Betting Odds — If you’re new to odds formats, start here
Tools
- Vig Remover Calculator — Strip the bookmaker’s margin from any odds
- Odds Converter — Convert between decimal, fractional, and American odds
- Free Betting Tracker — Track your BTTS bets and measure your edge over time