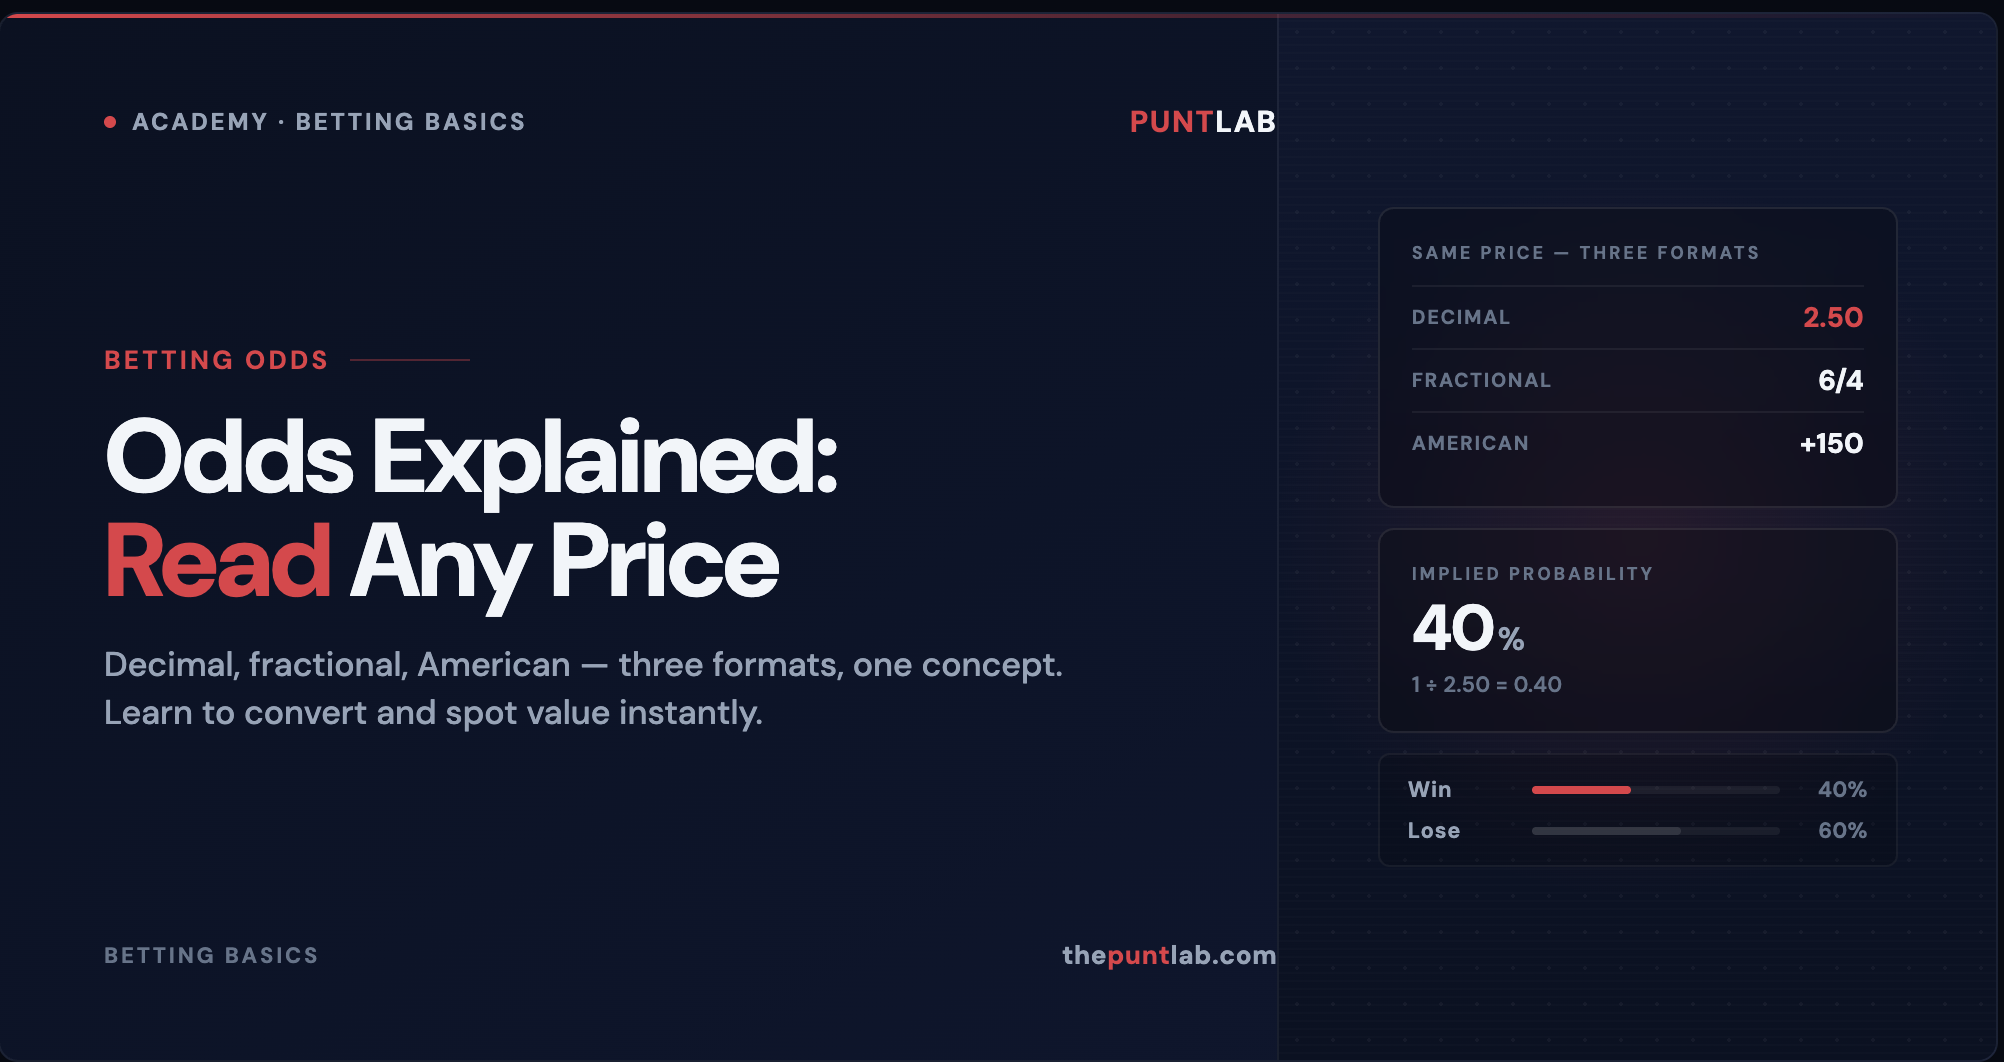
If you’re new to betting, odds can look like random numbers — especially when different formats appear depending on the sport, the country, or the bookmaker. You might see 2.50 in Australia, 6/4 in the UK, and +150 in the US, and wonder if they mean different things.
They don’t. They’re three different ways of expressing the same thing: what you get paid if you win. But here’s what separates recreational punters from serious ones — professionals don’t think in odds. They think in probabilities. Because the only question that matters is whether the price being offered is bigger than the true chance of the outcome occurring.
This guide will teach you how to read every odds format, convert between them instantly, and understand the concept that underpins every profitable bet ever placed: implied probability.
The Three Main Odds Formats
Decimal Odds (Australia, Europe, Asia)
Decimal odds are the standard in Australian and European betting. They represent your total return for every $1 staked — including your original stake.
Odds: 2.50 — A $10 bet returns $25 total ($15 profit + $10 stake).
Odds: 1.50 — A $10 bet returns $15 total ($5 profit + $10 stake).
Odds: 5.00 — A $10 bet returns $50 total ($40 profit + $10 stake).
The formula is simple: Stake × Odds = Total Return.
Decimals are the preferred format for serious bettors because they make calculations straightforward. There’s no mental gymnastics required — the number you see is the multiplier for your money. Every odds comparison table on PuntLab uses decimal format for this reason.
A decimal odds of 1.00 represents a certainty — you get your stake back and nothing else. Anything below 2.00 means the outcome is implied to be more likely than not. Anything above 2.00 means it’s implied to be less likely than not. The higher the number, the less likely the bookmaker believes the outcome is.
Fractional Odds (UK, Ireland)
Fractional odds are the traditional format in British and Irish racing. They show your profit relative to your stake — not your total return.
Odds: 6/4 — For every $4 you stake, you win $6 profit. Total return = $10.
Odds: 5/1 — For every $1 you stake, you win $5 profit. Total return = $6.
Odds: 1/2 — For every $2 you stake, you win $1 profit. Total return = $3.
The way to read them: the first number is your profit, the second number is your stake. “6/4” means “6 profit for 4 staked.”
To convert fractional to decimal: divide the first number by the second, then add 1.
6/4 = (6 ÷ 4) + 1 = 2.50. Same as the decimal example above.
Fractional odds are common in UK horse racing coverage and some football markets, but most Australian punters won’t encounter them regularly. If you do, convert to decimal for easier comparison.
American Odds (USA)
American odds are the standard in the US sports betting market. They come in two forms — positive and negative — and they’re the least intuitive format at first glance.
Positive odds (+150): This tells you how much profit you’d make on a $100 stake. +150 means a $100 bet returns $250 total ($150 profit + $100 stake).
Negative odds (-150): This tells you how much you need to stake to win $100 profit. -150 means you must bet $150 to return $250 total ($100 profit + $150 stake).
The dividing line is -100/+100, which is equivalent to 2.00 decimal (an even-money bet). Anything with a minus sign is shorter than even money; anything with a plus sign is longer.
To convert American to decimal:
Positive: (American ÷ 100) + 1. So +150 = (150 ÷ 100) + 1 = 2.50.
Negative: (100 ÷ |American|) + 1. So -150 = (100 ÷ 150) + 1 = 1.67.
If you bet across international sportsbooks — particularly US-facing platforms — you’ll need to be comfortable with American odds. But for day-to-day Australian betting, decimal is all you need.
Odds Converter Calculator
Convert between all three formats instantly and see the implied probability. Enter any odds format and the calculator does the rest.
Odds Converter
Convert between Decimal, Fractional & American odds
Implied Probability: The Most Important Concept in Betting
Odds aren’t just a payout number. They’re a statement of probability — the bookmaker’s estimate of how likely an outcome is to occur. Understanding this is non-negotiable if you want to bet seriously.
The conversion from decimal odds to implied probability is straightforward:
(1 ÷ Decimal Odds) × 100 = Implied Probability %
Some examples:
Odds of 2.00 → 1 ÷ 2.00 = 0.50 → 50%. The bookmaker considers this a coin flip.
Odds of 4.00 → 1 ÷ 4.00 = 0.25 → 25%. A one-in-four chance.
Odds of 1.50 → 1 ÷ 1.50 = 0.667 → 66.7%. A strong favourite.
Odds of 10.00 → 1 ÷ 10.00 = 0.10 → 10%. A roughie.
Once you start thinking in implied probability rather than raw odds numbers, everything changes. A horse at $4.00 isn’t “paying four bucks” — it’s a horse the market says has a 25% chance of winning. If you believe its true chance is 33%, you’ve found value. If you believe it’s 20%, the price is too short.
This reframing is the single biggest mental shift between recreational and serious betting. Stop asking “what does it pay?” Start asking “what probability does this price represent, and is it wrong?”
Why Implied Probability Matters More Than Odds
Here’s the core principle of every profitable betting strategy:
If your estimated probability of an outcome is higher than the implied probability of the odds, the bet has positive expected value.
Example: A team is priced at $5.00, which implies a 20% chance. You’ve done your analysis — form, data, team news — and you estimate their true chance at 30%. If you’re right, you’re being paid as if the outcome happens 1 in 5 times when it actually happens 3 in 10 times. Over hundreds of bets at that kind of edge, you make money.
This is the concept of expected value (EV), and it’s the mathematical foundation of professional betting. Every other concept in our Academy builds on this — the Kelly Criterion calculator tells you how much to stake when you’ve found value; the Vig Remover helps you calculate the true probability behind the bookmaker’s margin.
The Bookmaker’s Margin and “True” Odds
There’s one catch with implied probability: the bookmaker’s odds don’t represent true probabilities. They include a margin — the vig — which inflates the implied probabilities above 100%.
In a two-outcome market (say, a tennis match), if both players are priced at $1.90, the implied probabilities are 52.6% each — totalling 105.2%. That extra 5.2% is the bookmaker’s built-in profit. In reality, the true probabilities are 50/50 — but the bookmaker prices both sides as if they’re slightly more likely than they are.
This means the implied probability from raw odds always slightly overstates the true likelihood. To find the genuine market-implied probability, you need to strip the margin using our Vig Remover calculator. Our full guide on Market Percentages (The Vig) explains this process in detail.
Odds Movement: Why Prices Change
Odds aren’t static. They move constantly in response to money — both from the public and from sharp (professional) bettors. Understanding why odds move helps you assess whether a price is still value or whether the market has already corrected.
Money moves the line. When a large amount of money lands on one outcome, the bookmaker shortens the price to reduce their exposure. The opposing outcome drifts longer.
Sharp money moves it faster. Bookmakers track which accounts are profitable. When a known sharp bettor places a significant wager, the line moves immediately — sometimes before public money even arrives. This is called a “steam move.”
Late money is informative. Significant market movement in the last 30-60 minutes before an event often reflects new information — late team news, insider knowledge, or sharp money arriving. If a horse is $6.00 in the morning and $4.00 at jump, someone with better information than the public has acted.
For punters, the practical takeaway is that getting the best available price matters. Even small differences compound over time. A punter who consistently bets at 2.10 instead of 2.00 on the same outcomes is getting 5% better value on every single bet. Over a year, that’s the difference between profit and loss.
The Bottom Line
Odds formats are just wrapping paper. What matters is the probability underneath — and whether the bookmaker has it right.
Learn to convert odds to implied probability instinctively. Compare that probability to your own assessment. When the gap is in your favour, you have value. When it’s not, pass and wait for the next opportunity.
That discipline — combined with the tools to execute it — is what separates punters who win from punters who just bet.
Related Reading
- Market Percentages (The Vig) — How the bookmaker’s margin distorts every price
- What Is BTTS? — Both Teams to Score explained with real data
- Over/Under 2.5 Goals — How the goals line works and when to bet it
- Tote vs Fixed Odds — Which system pays more and when
Tools
Kelly Criterion Calculator — Optimal staking when you’ve found value
Odds Converter Calculator — Convert between decimal, fractional, and American
Vig Remover Calculator — Strip the margin to see true market probabilities