Category: Strategy & Math
If you want to move from being a casual punter to someone who bets like an investor, your biggest upgrade isn’t picking more winners — it’s sizing your bets properly. Most bettors don’t go broke because they can’t find value… they go broke because they stake too much when they’re wrong and too little when they’re right.
That’s where the Kelly Criterion comes in.
The Kelly Criterion is a proven staking formula used by professional bettors and serious investors to work out the optimal bet size based on your edge. The goal isn’t “winning today” — it’s maximising long-term bankroll growth while avoiding the kinds of blow-ups that kill most betting accounts.
What is the Kelly Criterion?
In plain English, the Kelly formula tells you what percentage of your bankroll to stake based on two things:
- Your estimate of the Probability of winning
- The odds being offered (your payout if you win)
If you have a strong edge, it tells you to stake more. If you have a small edge, it tells you to stake less. And if you have no edge, it’s brutal and honest: don’t bet.
This is important because even a great betting strategy can lose money if your staking is random. Kelly forces your staking to match your advantage — which is exactly what smart bankroll growth looks like.
The Kelly Criterion Formula
The formula looks intimidating at first glance, but it’s actually simple when you break it down:
(BP – Q) / B = Optimal Stake %
Where:
- B = Decimal Odds − 1
(Example: 2.50 odds → B = 1.50) - P = Your estimated [Probability of winning] (as a decimal)
(Example: 60% → 0.60) - Q = Probability of losing (1 − P)
What the result means
The output is the percentage of your bankroll that is “mathematically optimal” to stake, assuming your probability estimate is accurate over the long run.
Kelly Criterion Calculator
If you don’t want to calculate it manually every time, the calculator below will do the full Kelly maths instantly.
Kelly Criterion
Optimal stake sizing based on your edge
Practical Example: How it Works
Let’s use a clean example.
Imagine you’re betting on a coin toss, but you know the coin is weighted. You estimate it lands on Heads 60% of the time. A bookmaker offers 2.00 (even money) on Heads.
- Odds (B): 1.0 (2.00 − 1)
- Win Probability (P): 0.60
- Lose Probability (Q): 0.40
Calculation:(1.0 × 0.60 − 0.40) / 1.0 = 0.20
Kelly says the optimal bet size is 20% of your bankroll.
That doesn’t mean it will win today. It means that if your 60% estimate is genuinely accurate and you repeatedly take similar edges, staking at Kelly maximises your compound growth.
The Danger of “Full Kelly” (Read This First)
Here’s the part most people skip — and it matters.
Even though Kelly is mathematically optimal, “Full Kelly” can produce wild swings. If your probabilities are slightly off, or you hit a normal losing streak, staking 20% on a single bet is extremely aggressive.
That’s why many professionals use Fractional Kelly instead.
What is Fractional Kelly?
It means using a fixed fraction of the Kelly recommendation to reduce volatility:
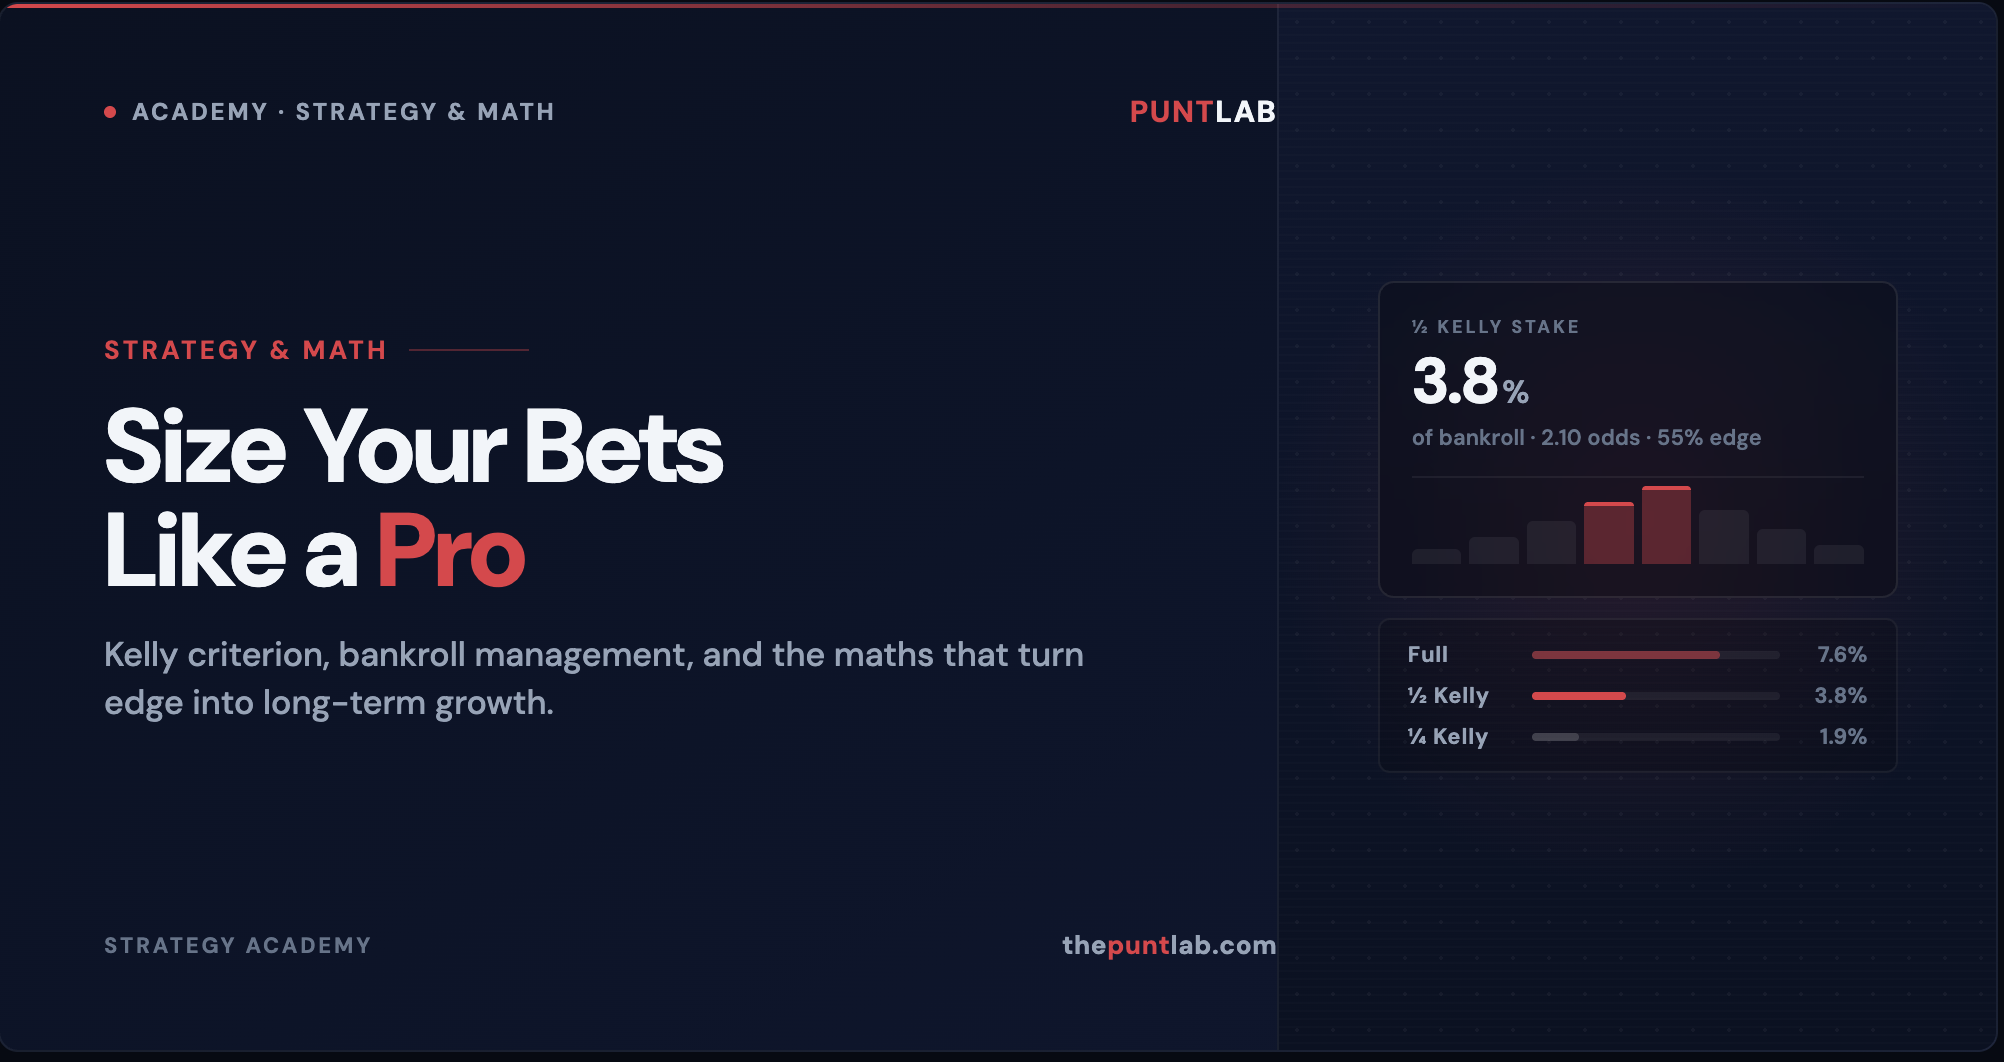
- Half Kelly: 50% of the Kelly stake
- Quarter Kelly: 25% of the Kelly stake
Using a Fractional Kelly strategy reduces variance massively while still keeping the main benefit: your stake size scales with your edge.
If your goal is longevity and steady growth, fractional Kelly is usually the smarter real-world approach.
When the Kelly Criterion works best
The Kelly approach is most useful when:
- You have a genuine, repeatable betting edge
- You can estimate probabilities consistently
- You bet regularly over a large sample size (not random one-offs)
- You want a structured bankroll management strategy that prevents emotional staking
If you’re guessing probabilities, Kelly won’t save you — it will amplify your mistakes. But if you’re truly finding edge, it’s one of the most powerful staking frameworks ever created.